Concurrent users
Introduction
This plugin shows how many different users are using the cluster at the same time.
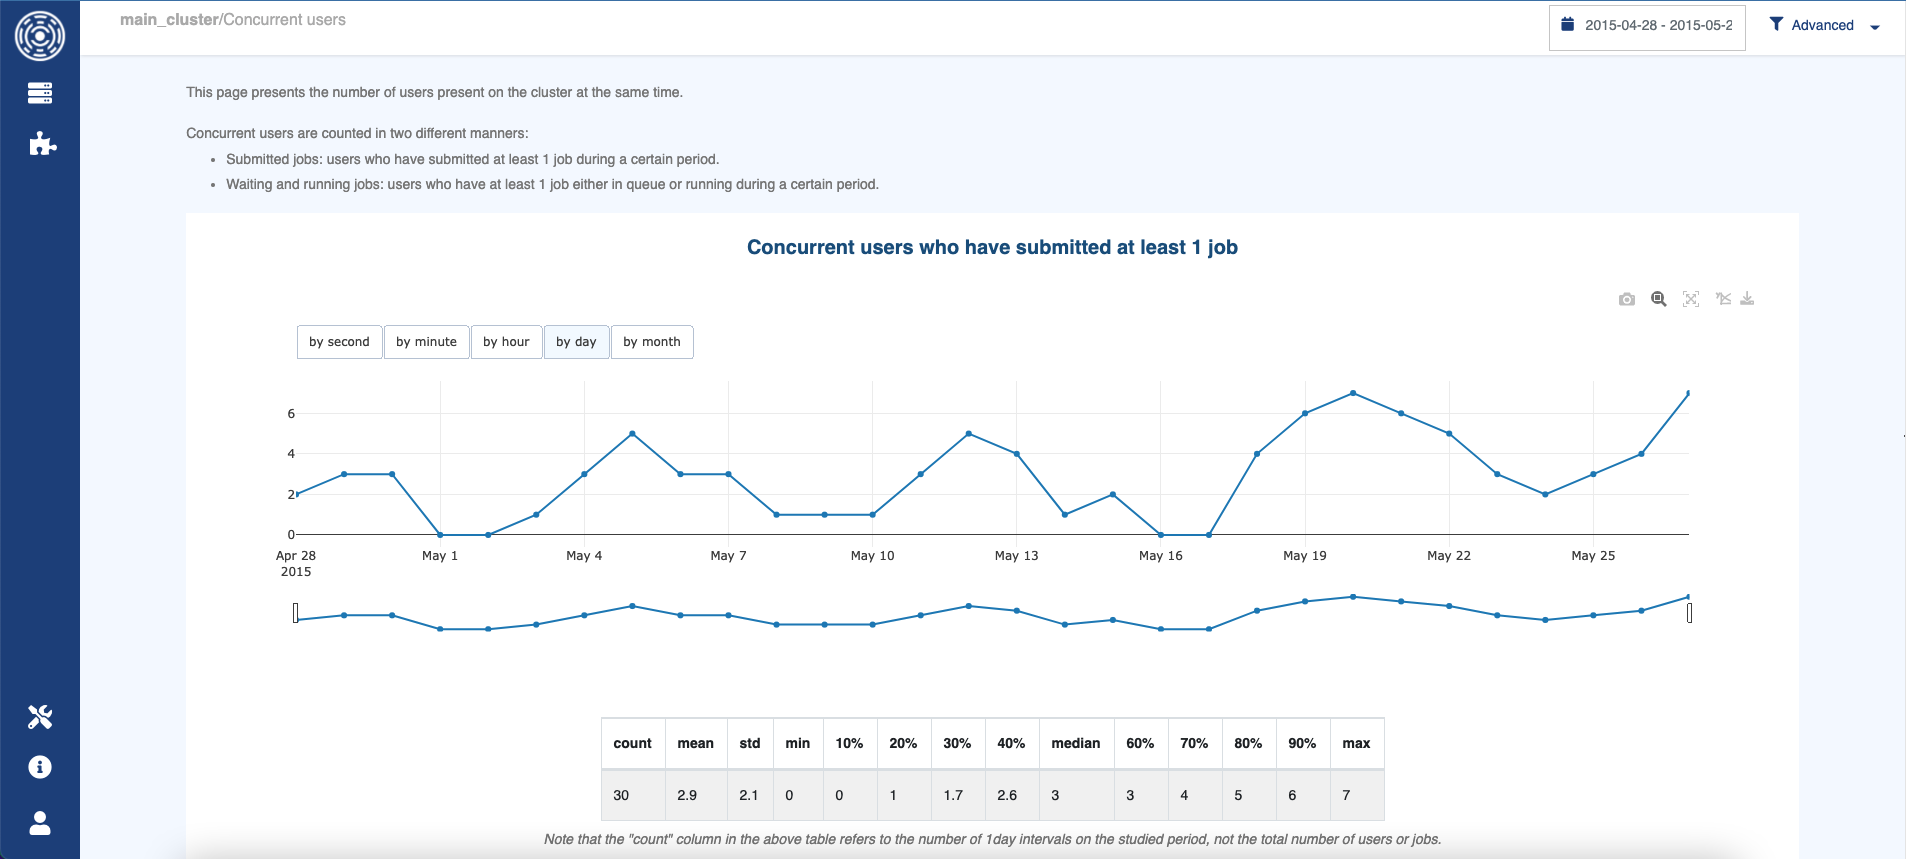
The first graph displays the number of users who have submitted at least 1 job.
The second graph shows the number of users with at least 1 job waiting or running.
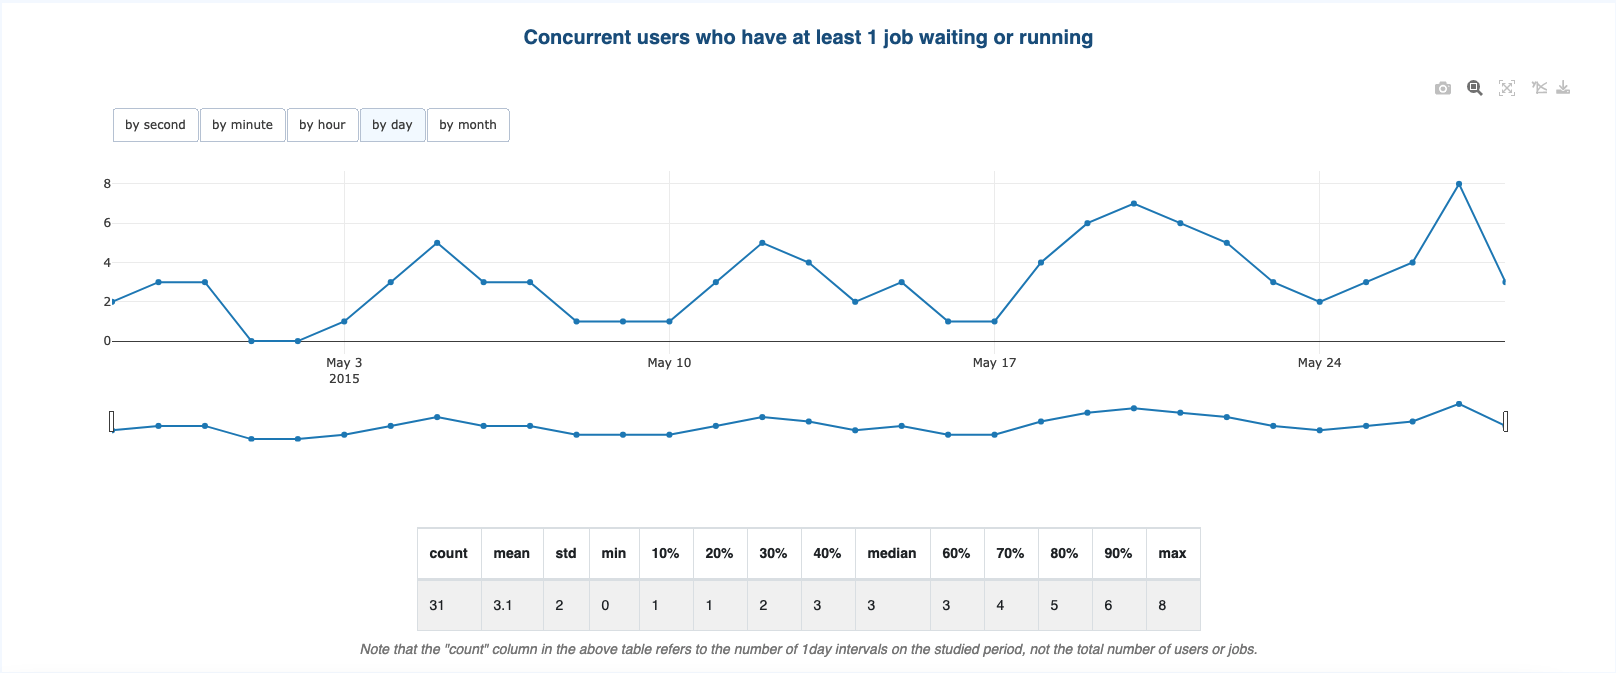
You can choose the time period on which to count the concurrent users using the buttons
on the left side of the graphs (by second, by minute, by hour, by day, by month).
For example, by minute will compute the number of users that used the cluster for each minute.
The tables below each graph show basic statistics on the computed concurrent users.
Key metrics
Who have submitted at least 1 job per [second, minute, hour, day, month]
Who have at least 1 job waiting or running per [second, minute, hour, day, month]