Filters
Different type of filtering is available in OKA. You can toggle any of those filtering options - when available - by clicking on the icons at the top right of the window.
Each of those icons will open an individual edition zone where you will be able to configure the filters.
Control over filters can be either per filter or all at once.
Each filter section will have its own Apply, Cancel, Close, Reset button (visible on hover) so that you can act on them individually.
Global control will always be accessible at the bottom of the display zone for filters.
Apply All: Apply all currently configured filters.Cancel All: Discard any unapplied changes to your filters.Close: Close all filters edition windows without losing any modifications you might have made.Reset All: Reset all filters values to theirdefault(e.g. date range: Last 30 days).
Date filter
For most of the plugins, you will be able to filter on a specific period using the date filter. A tooltip on hover of the filter shows you the date feature that will be filtered:
Jobs submit date for most of the plugins
The start date for the line item for CloudSHaper consumption reports
Dates associated to load values for Load and Meteo Cluster plugins
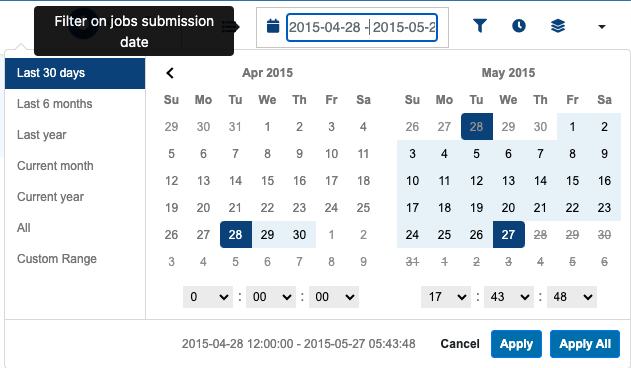
You can select a start and end date on which to filter the data displayed in the current plugin.
Use the Apply button to apply your changes.
Use the Apply All button to apply all current changes from this filter and others.
These changes will be saved in session and reloaded upon reconnection on this plugin or on other plugins using the same data.
By default, only the last 30 days of data are displayed to avoid requesting too much data.
The left panel of the date filter allows you to request data for the last 30 days, 6 months, year or all your data.
These filters are period-related. A filter profile using Last 6 months will always display the last 6 months of data whatever the dates are.
Advanced filter
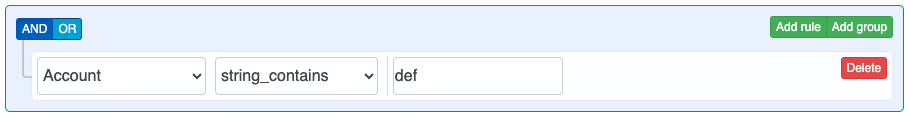
The advanced filter allows to create groups of rules to filter the data displayed in the current plugin. All fields saved in the database are available in the advanced filter. For example, in the State plugin, you will be able to filter the jobs with a specific account and more than 1 allocated CPU.
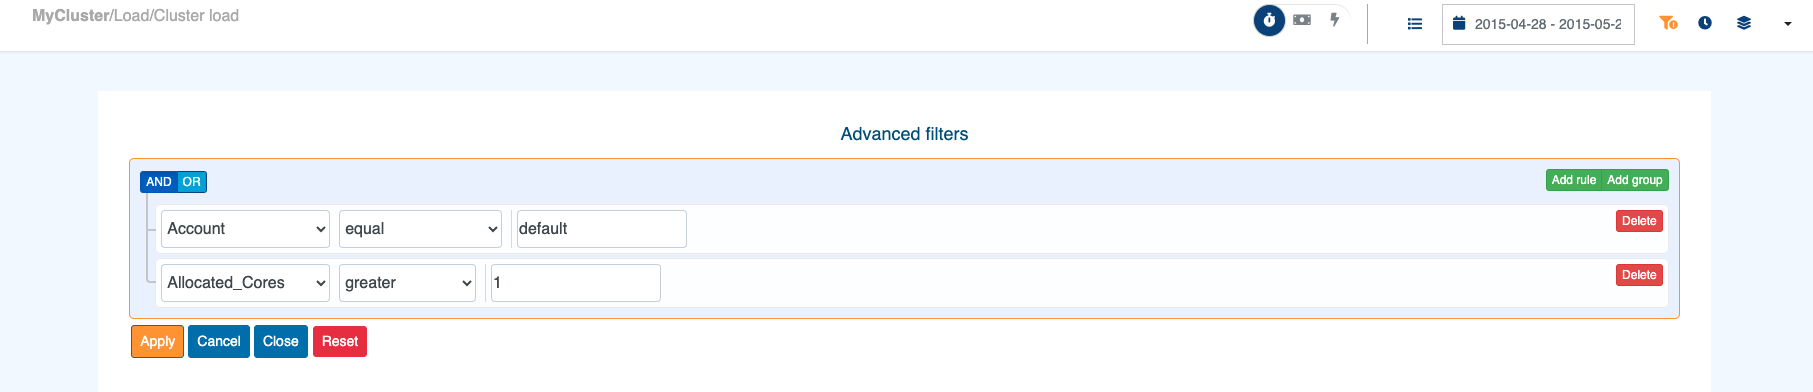
Depending on the plugin, the advanced filter will apply on different data:
Jobs accounting fields for most of the plugins
Cloud reports columns for CloudSHaper consumption plugin
Nodes features for Load occupancy plugin
Depending on the selected field, different operators are available:
For
Stringfields:equal: filter on field value equals some string.not equal: filter on field value doesn’t equal some string.begins with: filter on field value begins with some string.doesn't begin with: filter on field value doesn’t begin with some string.ends with: filter on field value ends with some string.doesn't end with: filter on field value doesn’t end with some string.in: filter on field value in the provided strings list (comma-separated values).
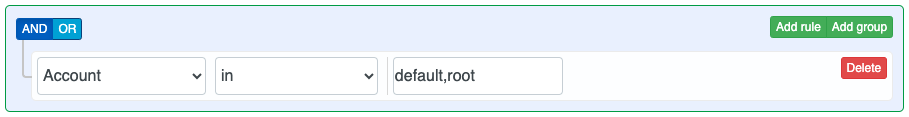
not in: filter on field value not in the provided strings list.is empty: filter on an empty field.is not empty: filter on a not empty field.string_contains: filter on field value contains some string.
Note
This operator supports regular expressions (regex) to search for a pattern in the selected string field.
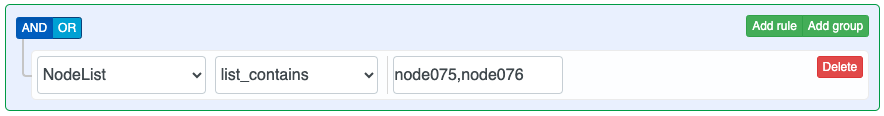
string_not_contains: filter on field value doesn’t contain some string.list_contains: filter on field values contain one or more strings. This operator is specific to list field (e.g.NodeList,Partitionfor occupancy plugin).
Note
This operator is non-exclusive. It will search for the documents having at least one of the provided strings in the list field. This field may contain other values in addition to the one you are searching. Use
equaloperator to filter on field values that equal exclusively to one or more strings. Usestring_containsoperator to filter on field values that contain all the provided strings (but not exclusively).list_not_contains: filter on field values don’t contain one or more strings. This operator is specific to list field (e.g.NodeList,Partitionfor occupancy plugin).
For
Numericfields:equal: filter on field value equals some number.not equal: filter on field value doesn’t equal some number.less: filter on field value less than a number.less or equal: filter on field value less or equals to a number.greater: filter on field value greater than a number.greater or equal: filter on field value greater or equals to a number.between: filter on field value between two numbers (included).not between: filter on field value not between two numbers (excluded).
An automatic completion will suggest you some values for the string fields.
Use the Apply button to apply your changes.
These changes will be saved in session and reloaded upon reconnection on this plugin or on other plugins using the same data.
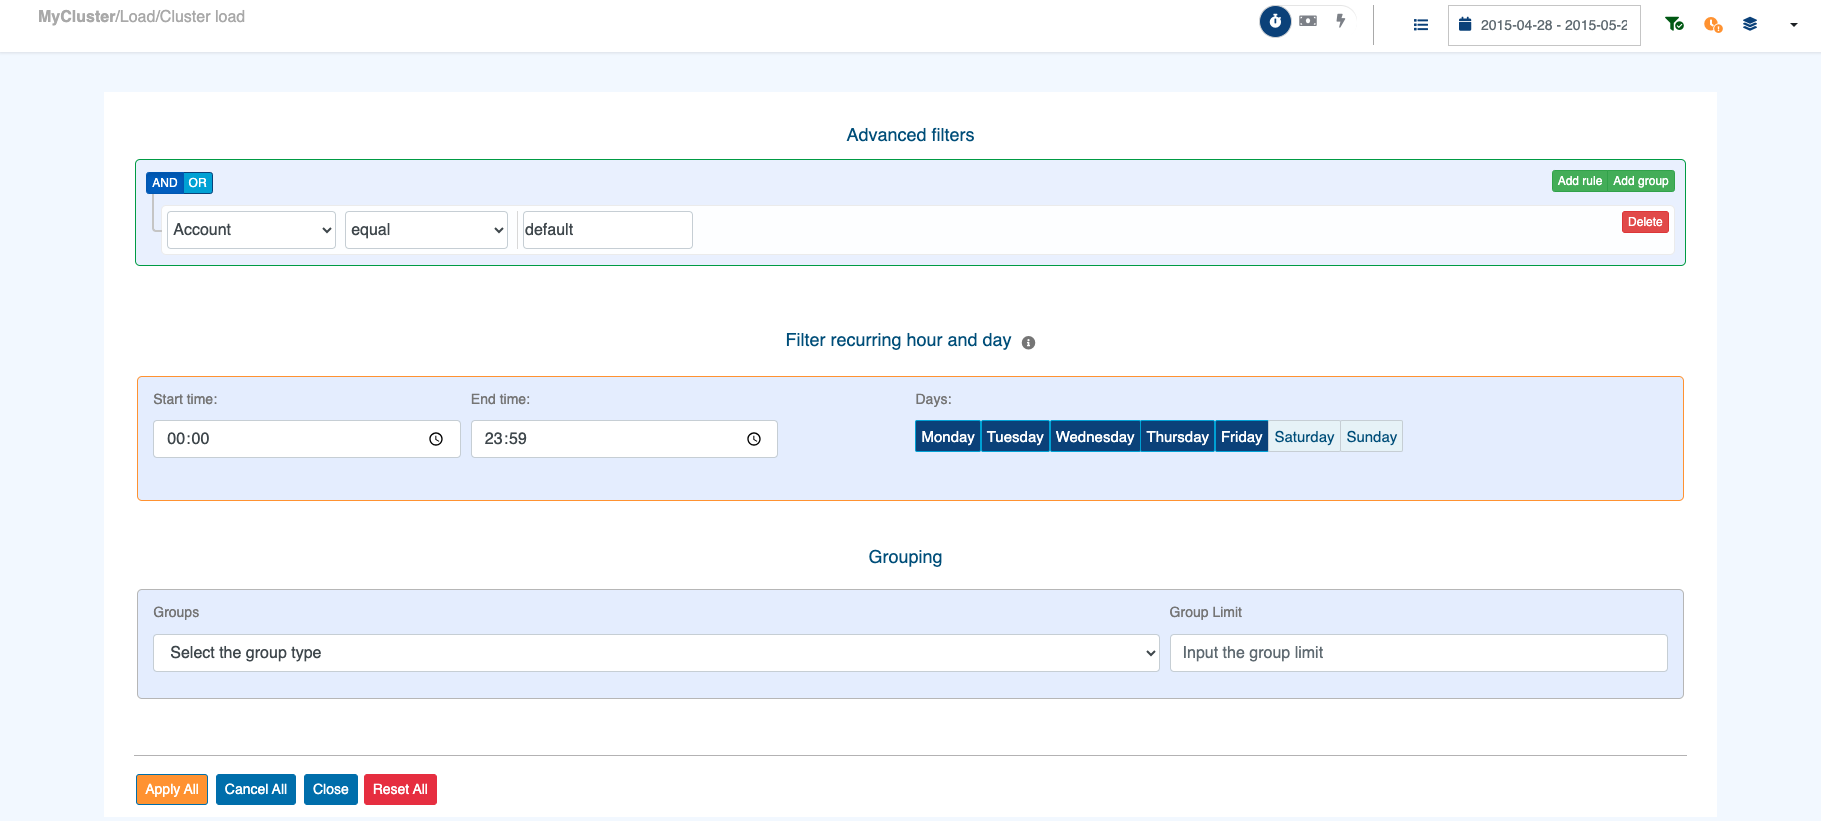
Recurring hour and day filter
This filter allows you to focus on specific period of time by selecting recurring hours and days. It uses the submission time as a reference point. By default, all days are included.
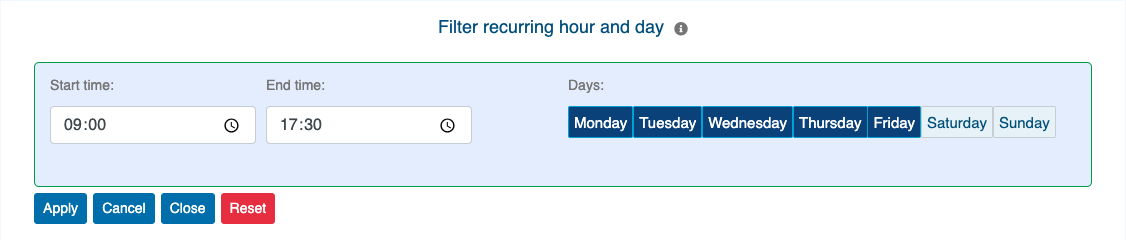
Start/End Time Specify start and end time for the period of time to cover within selected days. Both time will be included within the period. For example, if you decide to use
09:00to17:30, the result will contains data within the following interval[09:00:00 , 17:30:59]Days: Select the days within which to look for data in the selected Start/End time interval.
![]()
To access this filter, simply click on the clock icon located in the top right corner. The icon’s color provides important information:
Grouping
OKA also provides on some of its plugins an additional system to facilitate the comparison of multiple categories at once,
instead of having to filter on each of them individually.
This functionality allows data to be grouped based on a selected category and a given number of groups to be displayed.
When grouping data, the first N groups (the number specified by the user) representing the most jobs for the current filtering will be displayed individually.
All other elements available for the selected category will be combined and displayed as a single group named Others.
UI
Grouping is available through a dedicated button on the right side of the top bar.
As shown in the following picture, current state is reflected on the Grouping icon.
If any unapplied changes are made, the icon turns orange and a small ! icon is added.
Once a grouping is requested and applied, the icon turns green and a small ✓ is added.
Otherwise, the icon is blue.
![]()
When you click on the grouping icon, a panel allowing you to select the grouping category as well as the number of groups you want is displayed:
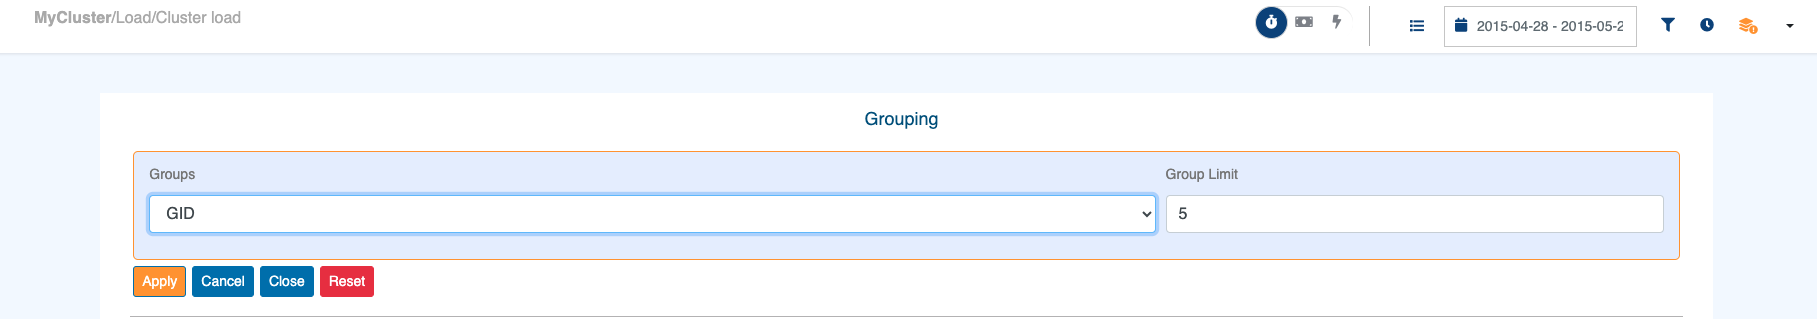
To group data, you need to specify:
Groups: A dropdown containing all the categories for which grouping is possible.Group limit: The number of individual groups to display,Ngroups +Others. If the number of element in the selected category is less or equal toN, only individual groups will be displayed.
The following actions are available through the buttons:
Apply: Confirm grouping with selected inputs.Cancel: Cancel changes in selected fields. Revert to previous configuration.Close: Close the panel.Reset: Reset the current grouping configuration.
Examples
Line and Scatter Graphs
By clicking on the legends, a group can be removed from the graph or added back.
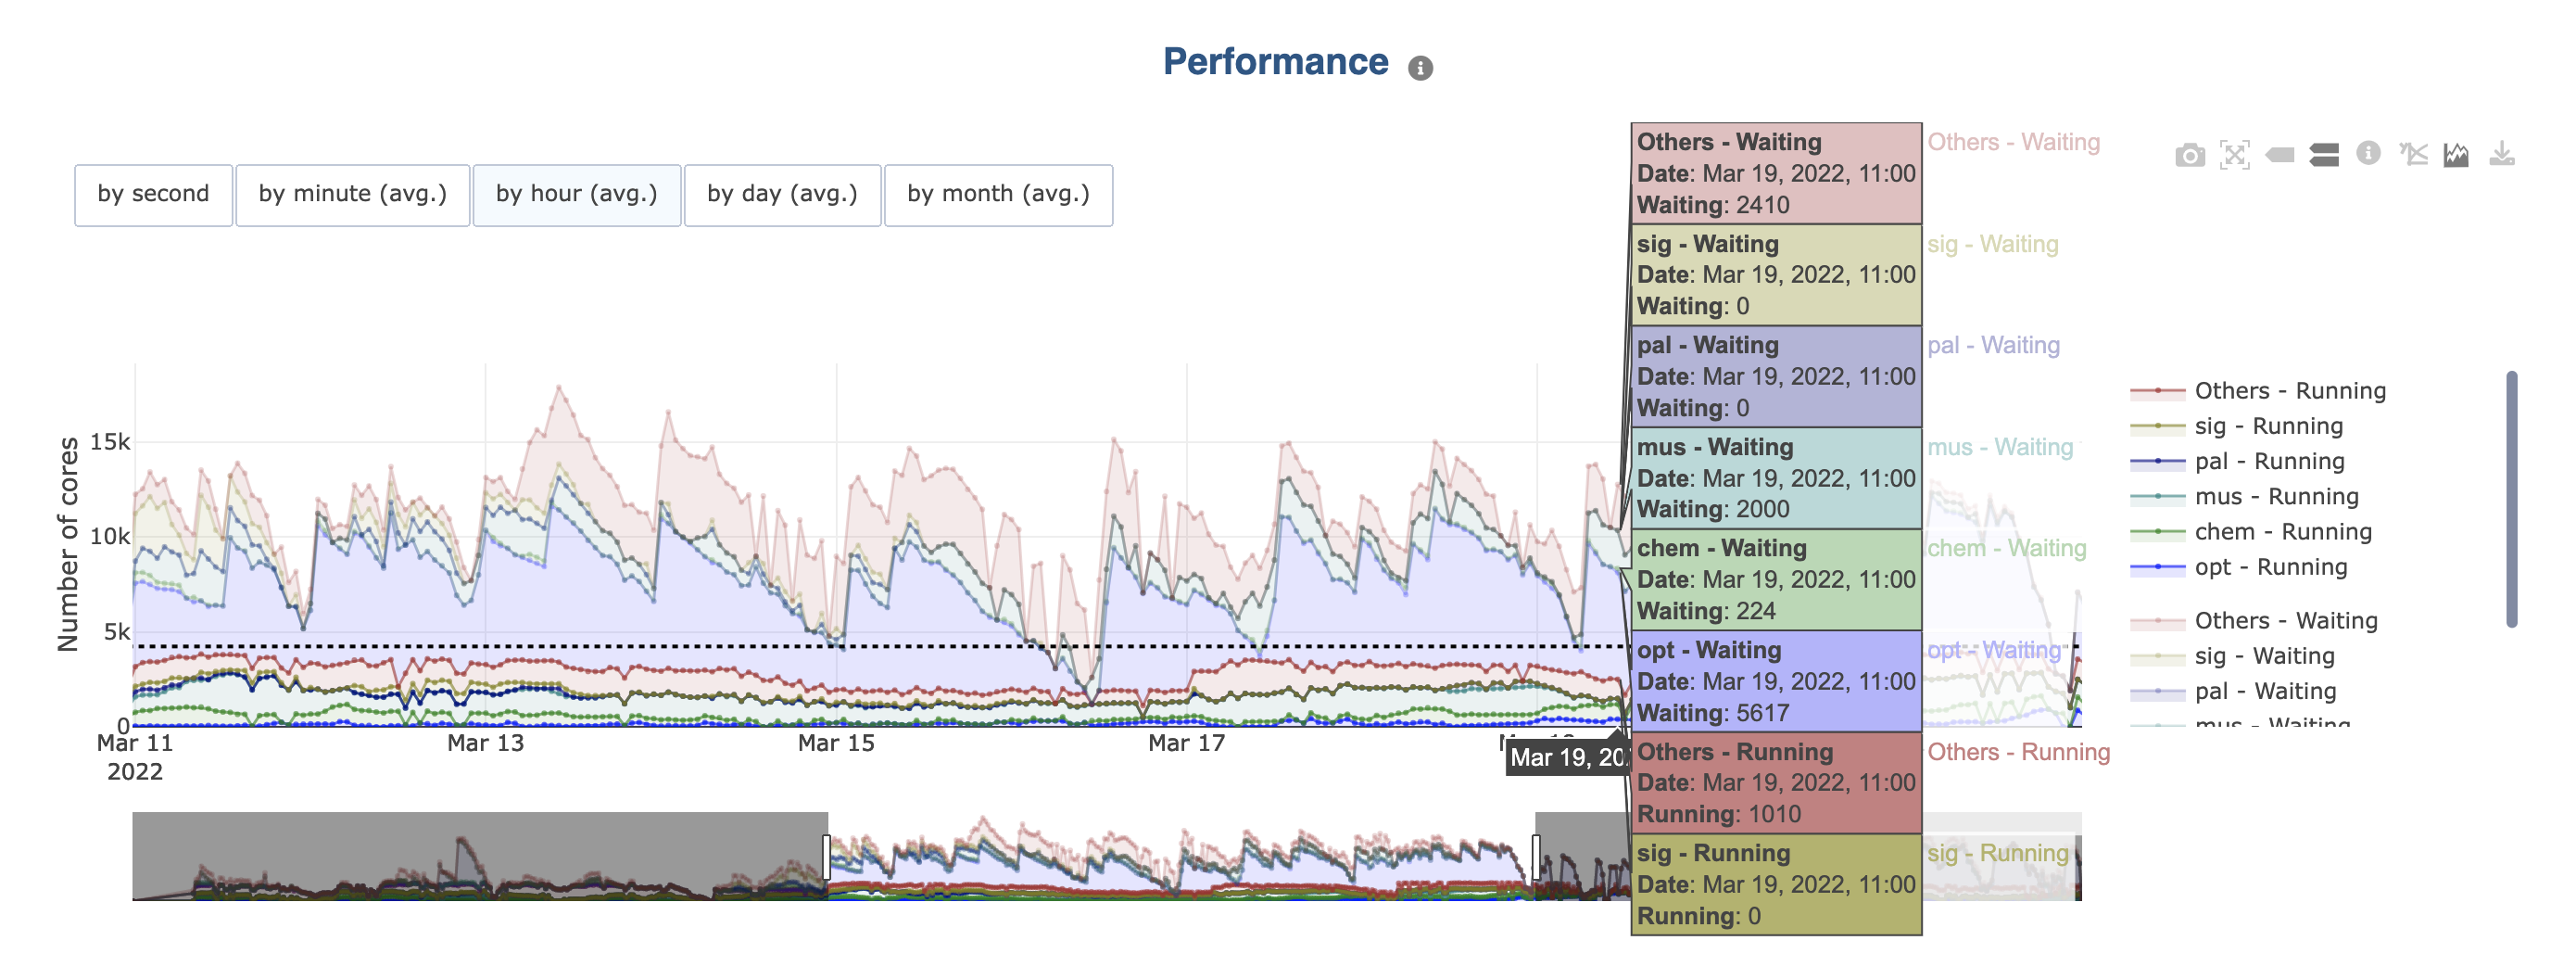
If the initial graph already contains multiple categories (e.g., in Load the Cluster load displays “Running” and “Waiting” cores):
Legends are grouped per category (e.g., running and waiting). You can hide/show them all at once by clicking a category element in the legend.
Colors are the same for each group in each category, but the opacity of the colors in one of them is reduced.
Bar Graphs
There are multiple cases for bar charts:
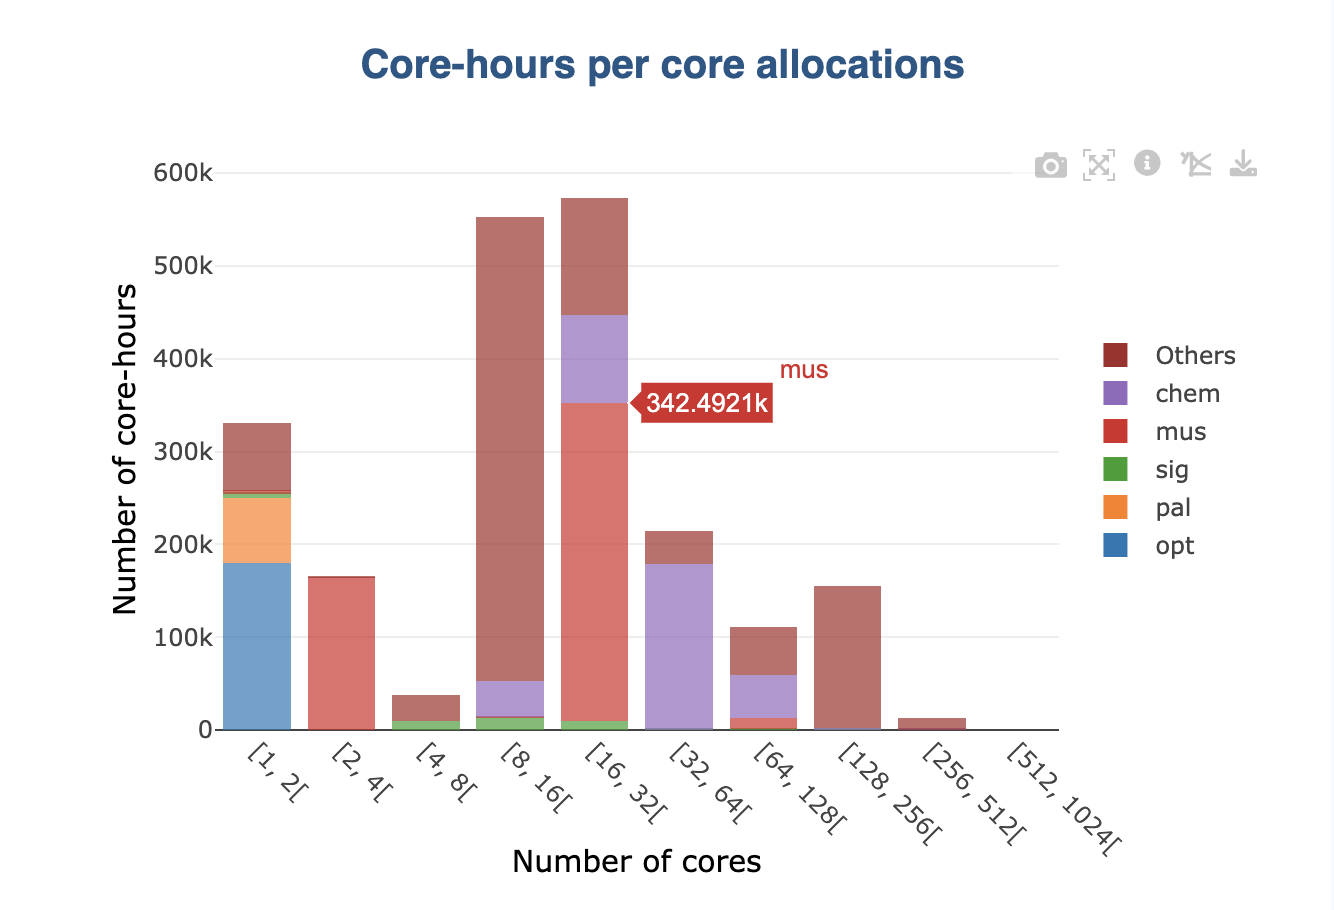
By default, the grouping is displayed as a stack on graphs (see picture above). This is the case for all values that can be summed (e.g., number of jobs):
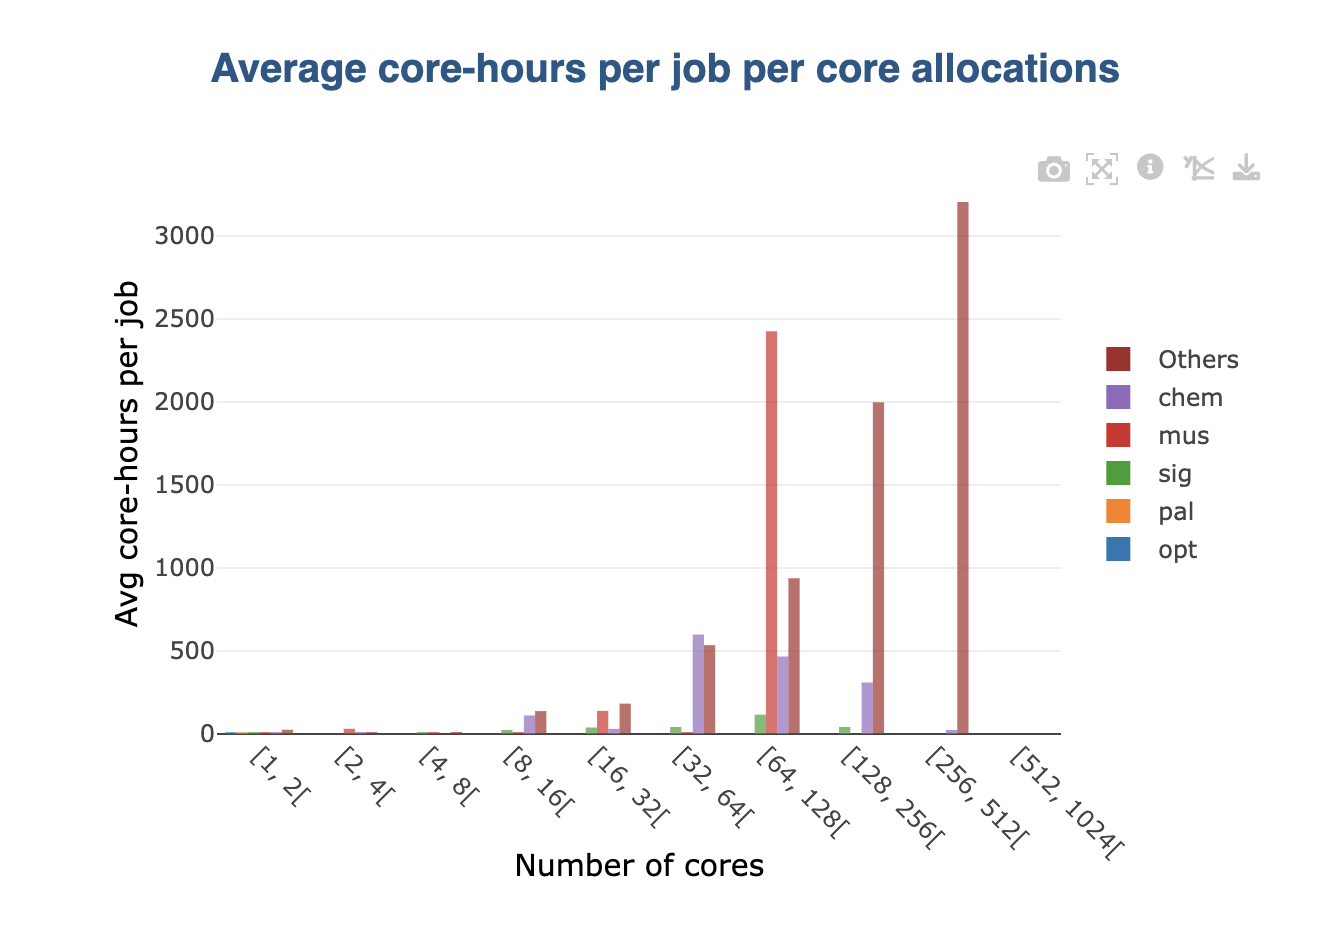
When a non-summable is displayed in the original graph (e.g., averages), stacking wouldn’t make sense. In this case, groups are displayed side by side:
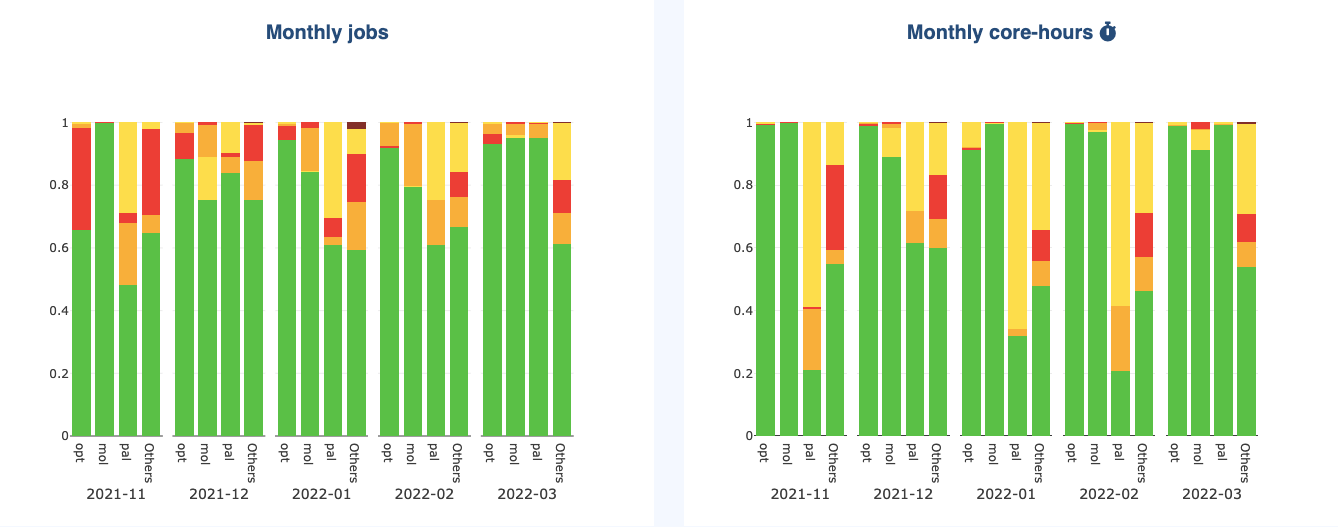
If the original graph already displays stacked values (e.g., job status per month), then the selected grouping is shown as subgroups displayed side by side:
Sunburst Graphs
Sunburst graphs allow to visualize hierarchical data spanning outward radially from root to leaves. It is an “extension” of more classical Pie charts. The inner ring displays the initial data, while the outer ring displays the grouping for each category present in the inner ring:
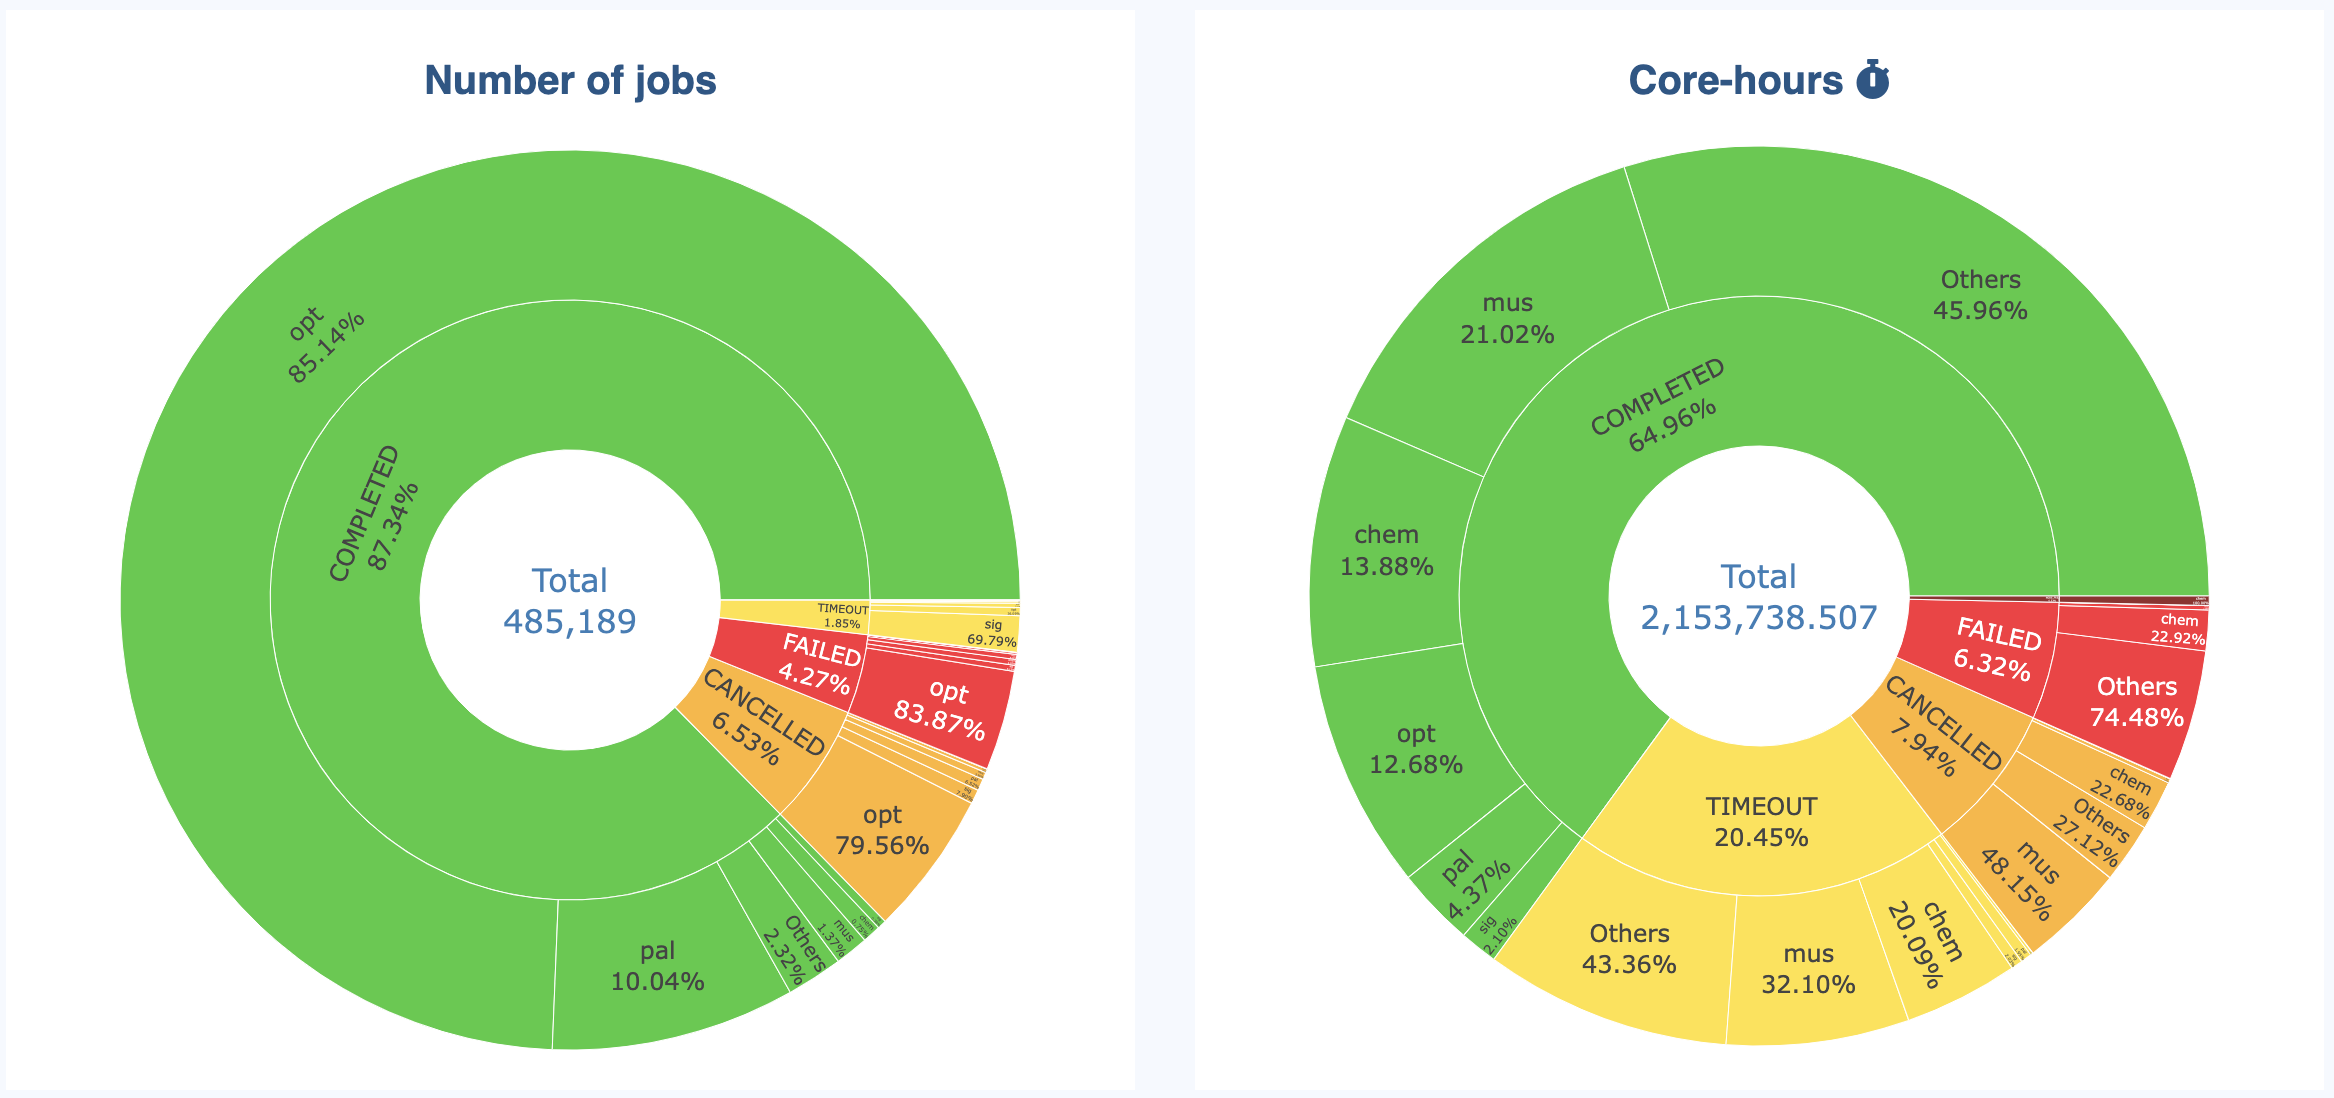
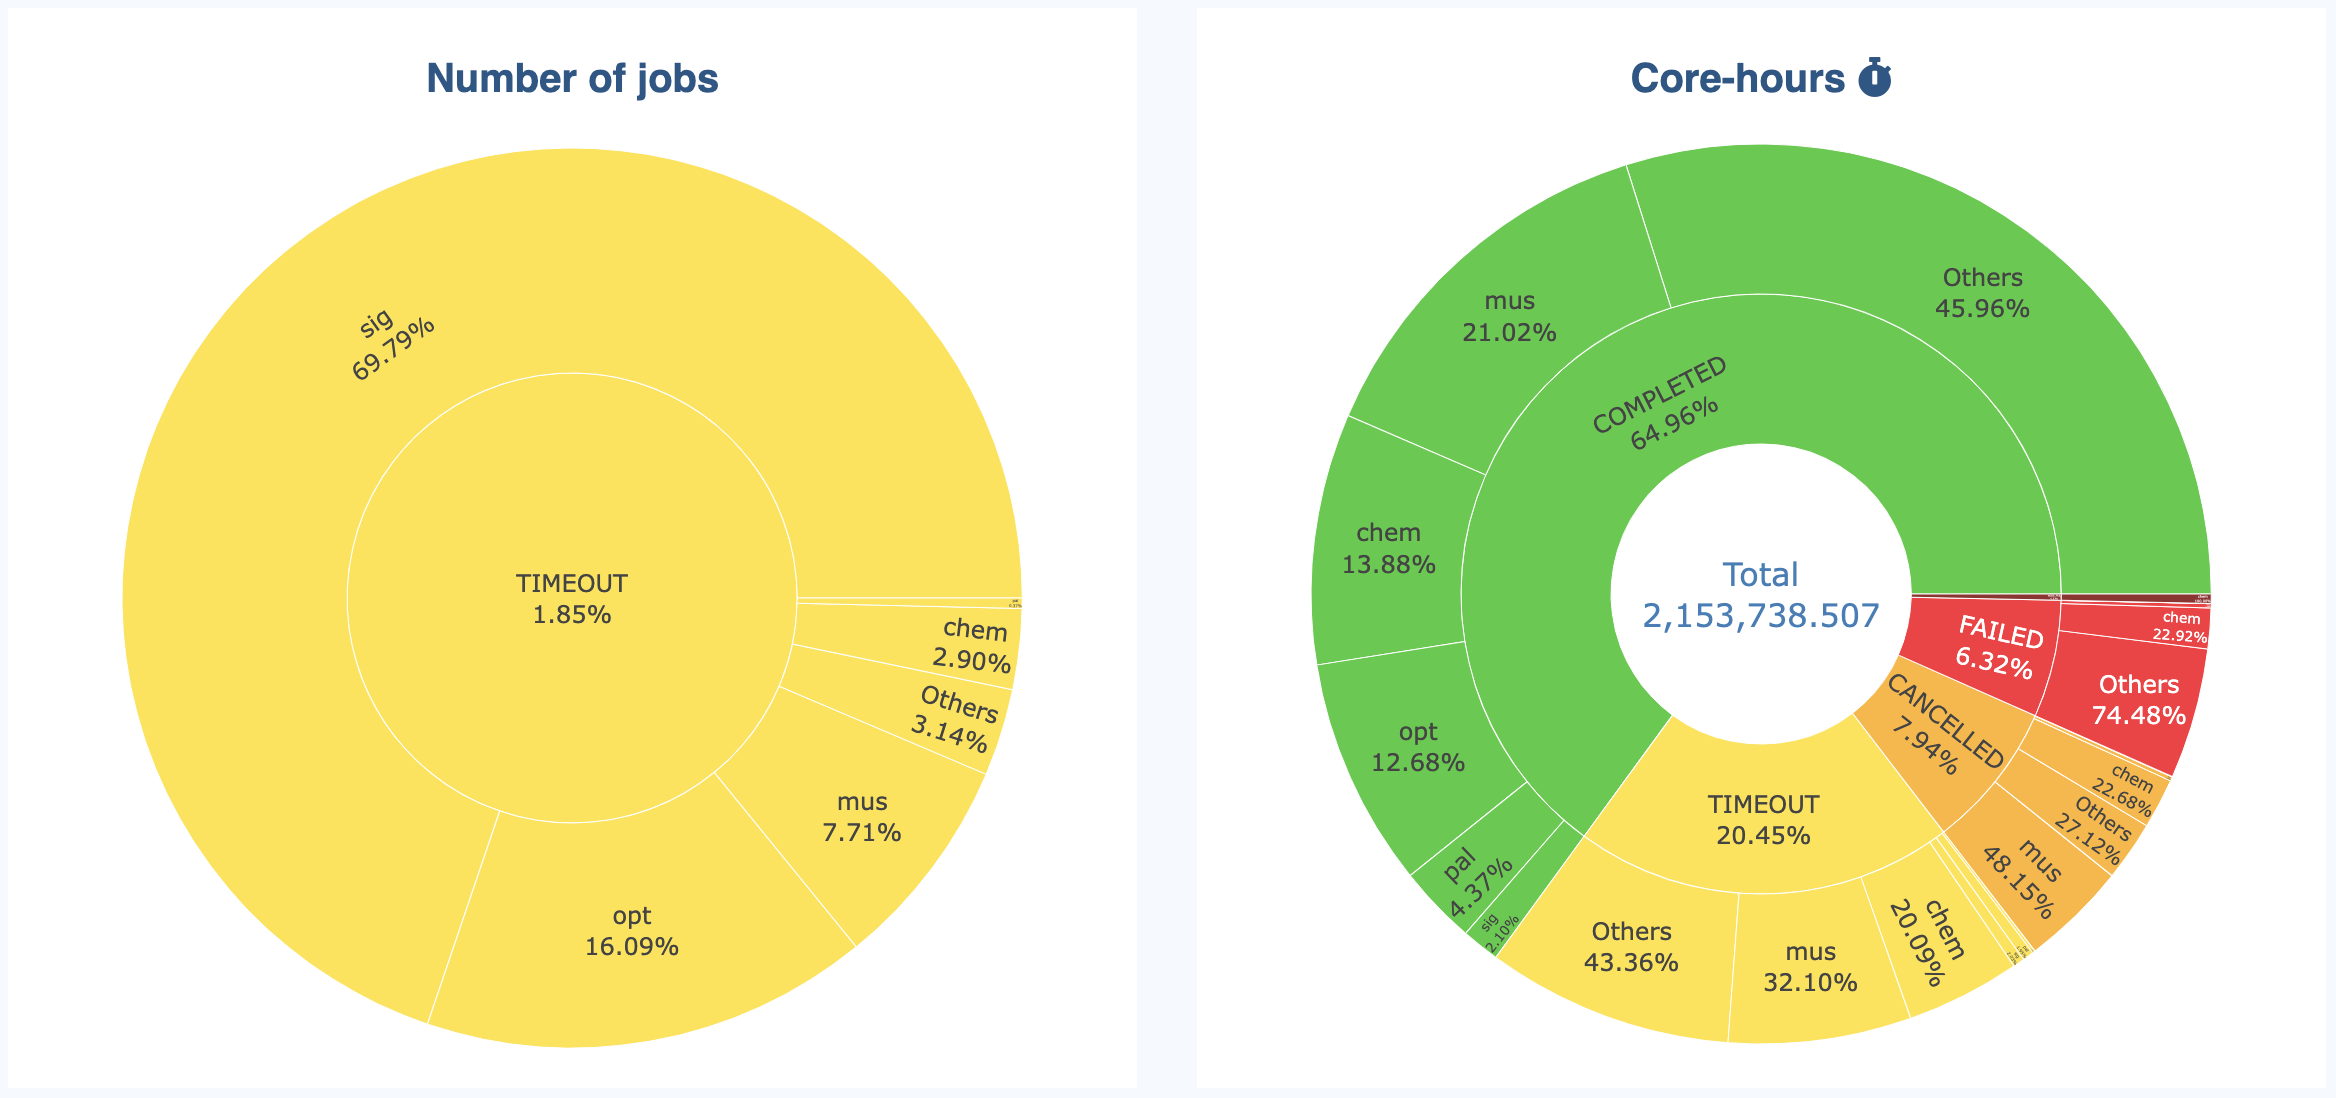
The sunburst allow to see the details in an interactive way. You can hide categories in the inner ring to “zoom” on the other categories:
Tables
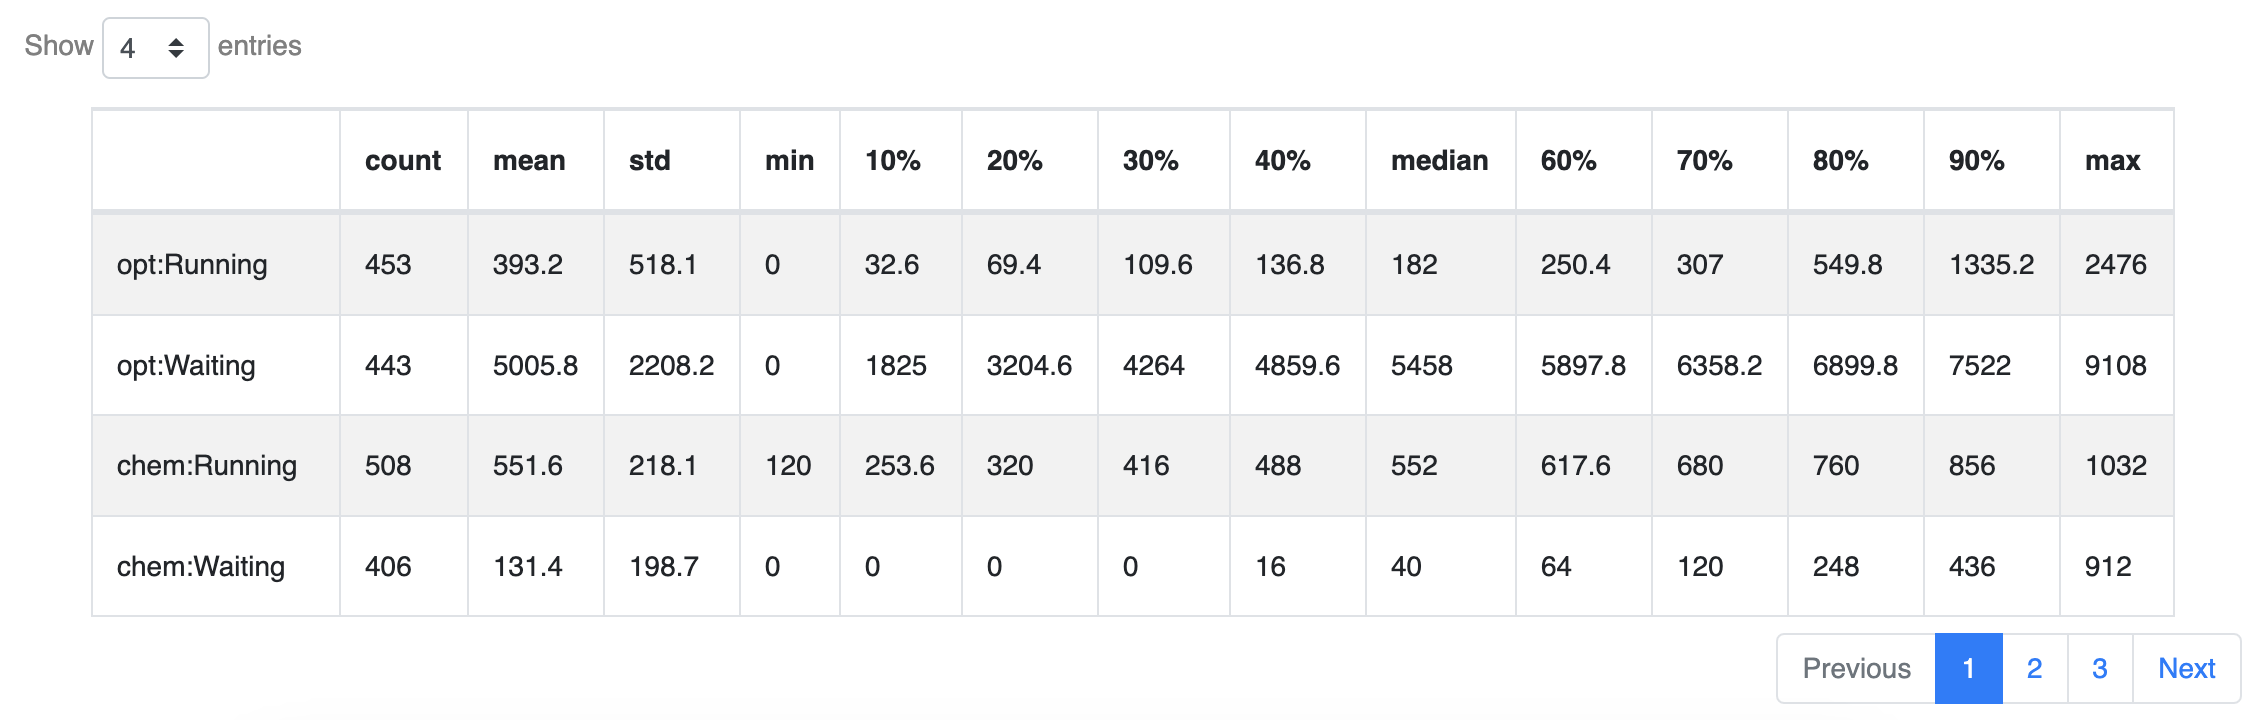
Groups are displayed in tables as separate rows. Note that since the number of rows will increase, pagination becomes may active when grouping.
Tabs
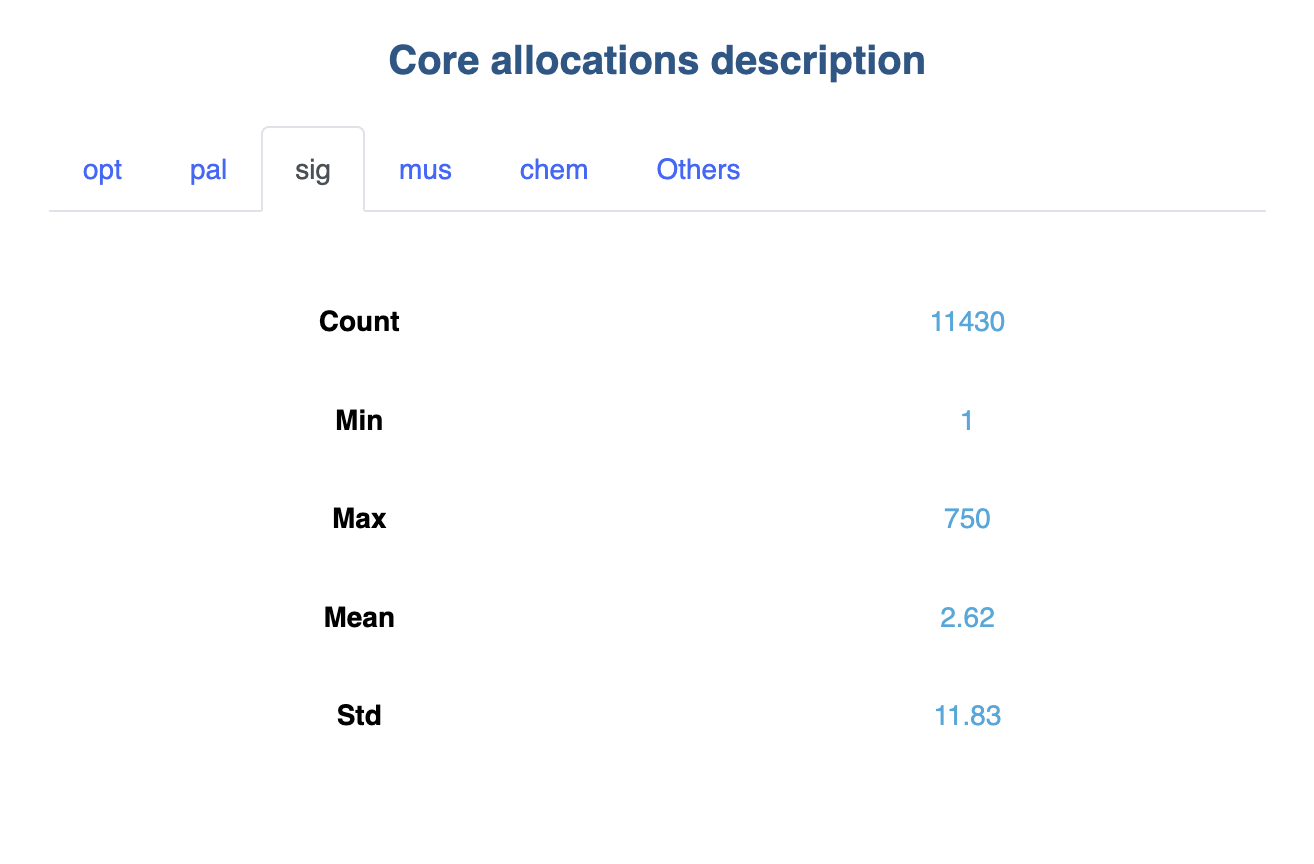
When information is displayed in a specific cell on a page, additional tabs are added to present the information group by group:
Save filters as profile
Date and advanced filters can be saved into a profile to be reused afterwards.
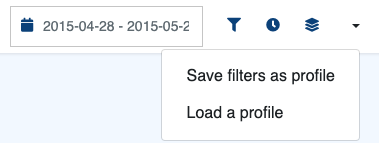
To create a new filters profile, first configure your date and advanced filters.
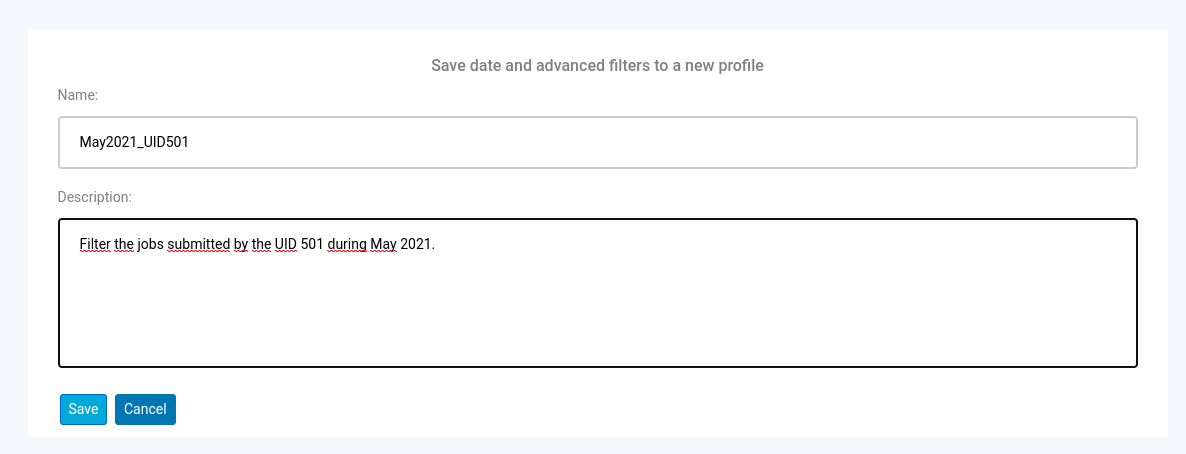
Then click on Save filters as profile, choose a filter name and fill in the description (optional).
You can select a filter profile by clicking on Load a profile.
When switching profile, do not forget to click on the Apply button to apply the selected profile.
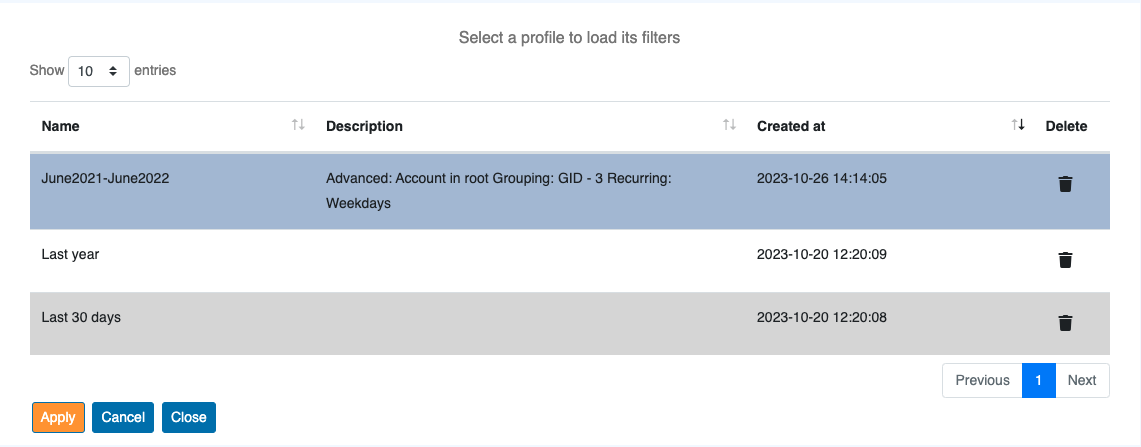
You can also delete a filter profile from this panel.