Diagnostic
This page provides access to an overview of OKA’s current health and the latest logs available.
Status
This tab provides various information regarding requirements and service status to ensure OKA is functioning properly without major issues. Green or red dots next to each element indicate whether everything is working as it should. Additional warnings may sometimes be displayed in orange text.
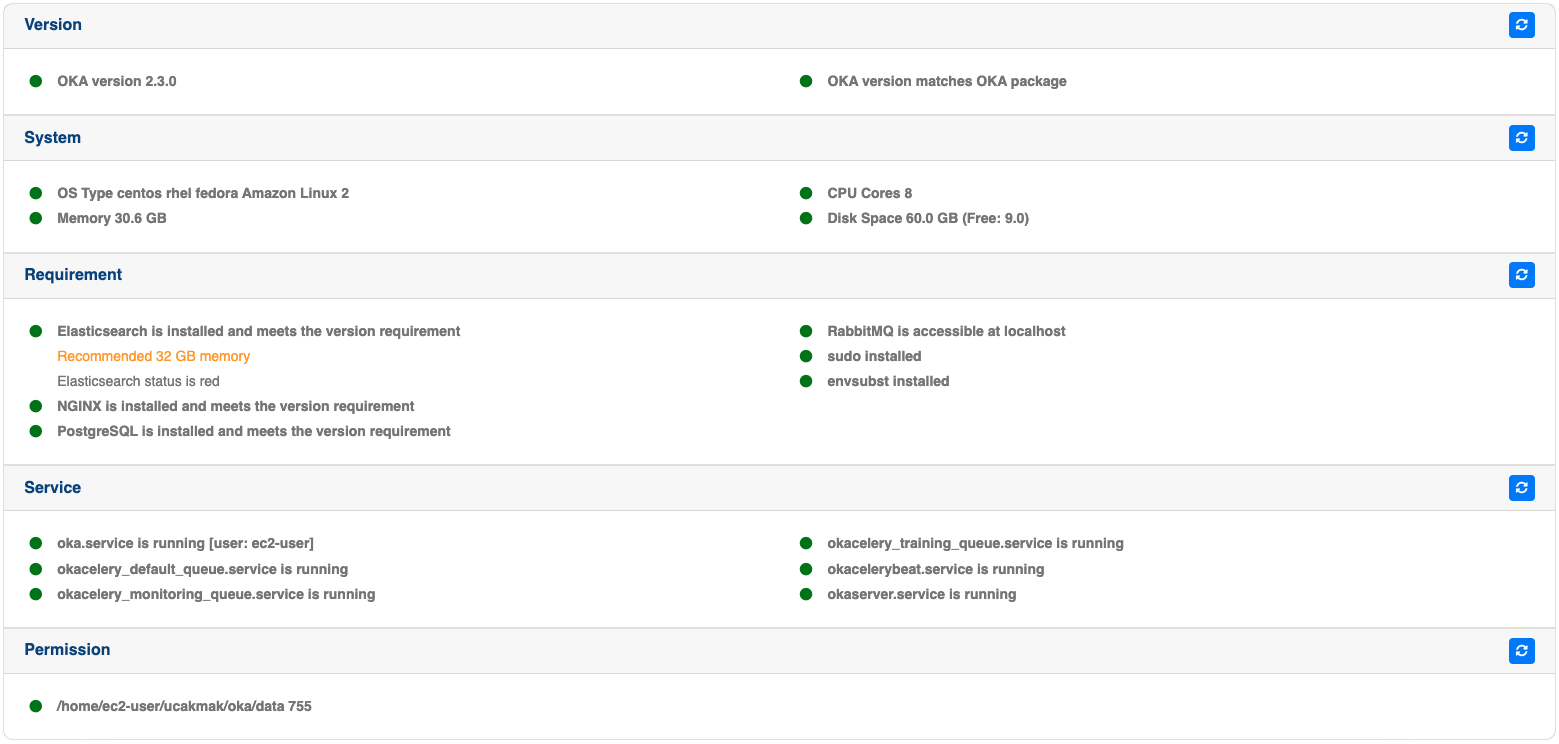
Version: Check that OKA version is correct and matches the installed package.System: Check that the system specifications (OS type, memory, CPU cores, and disk space) meet the software requirements.Requirement: Check that all requirements are properly installed and configured.Service: Check the status of essential services and ensure that they are running as expected.Permission: Check that the necessary permissions are set correctly.
Logs
The logs provide detailed information about the system’s operations and any issues encountered. Using the datatable functionalities you can easily filter and navigate through the logs.
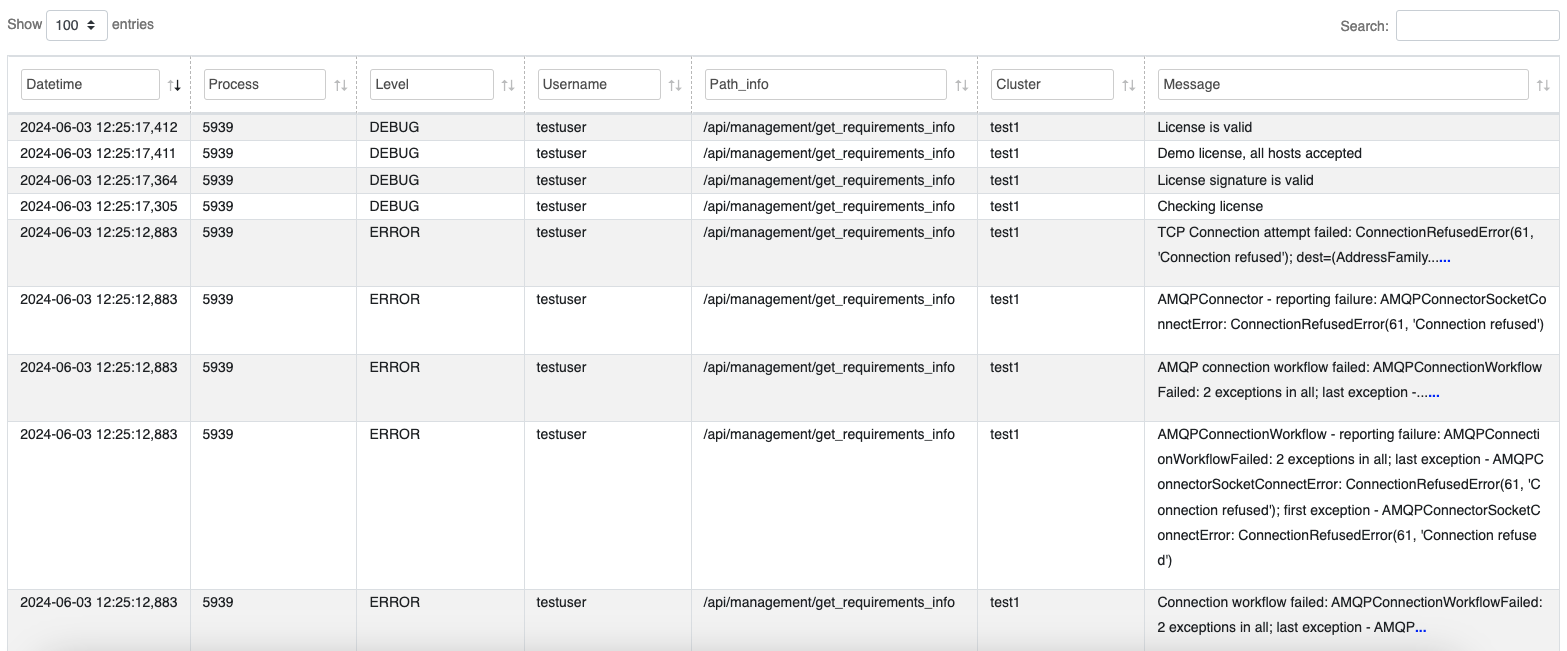
Date: The timestamp indicating when the log entry was created.Process ID: The unique identifier for the process that generated the log entry.Log Level: The severity level of the log entry (e.g., DEBUG, ERROR).Username: The user account under which the process was running.Path Information: The API endpoint or system path associated with the log entry.Cluster: The cluster associated with the log entry.Message: The detailed message describing the log event, including any error messages or status updates.