Throughput
Introduction
This plugin analyzes the frequency at which jobs are submitted and enqueued by the job scheduler, as well as their slowdown (time spent by a job on the cluster over its execution time).
Key metrics
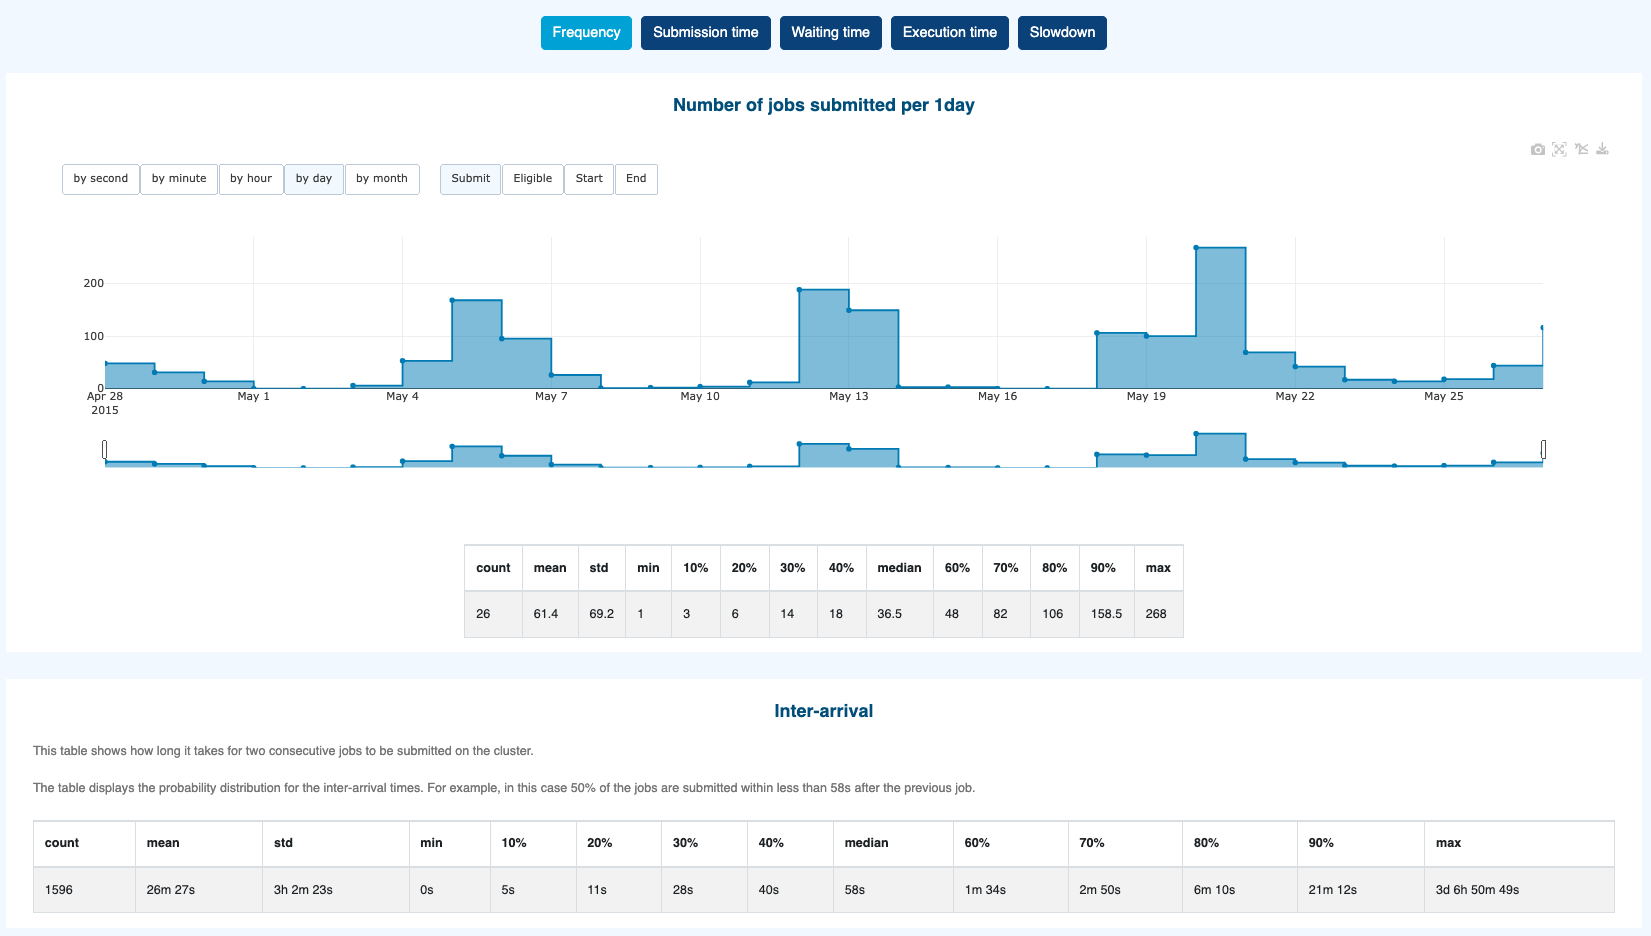
Number of jobs
Submitted,Eligible,StartedorEndedpersecond,minute,hour,dayormonthInter-arrival, shows how long it takes for two consecutive jobs to be
Submitted,Eligible,StartedorEndedon the cluster.
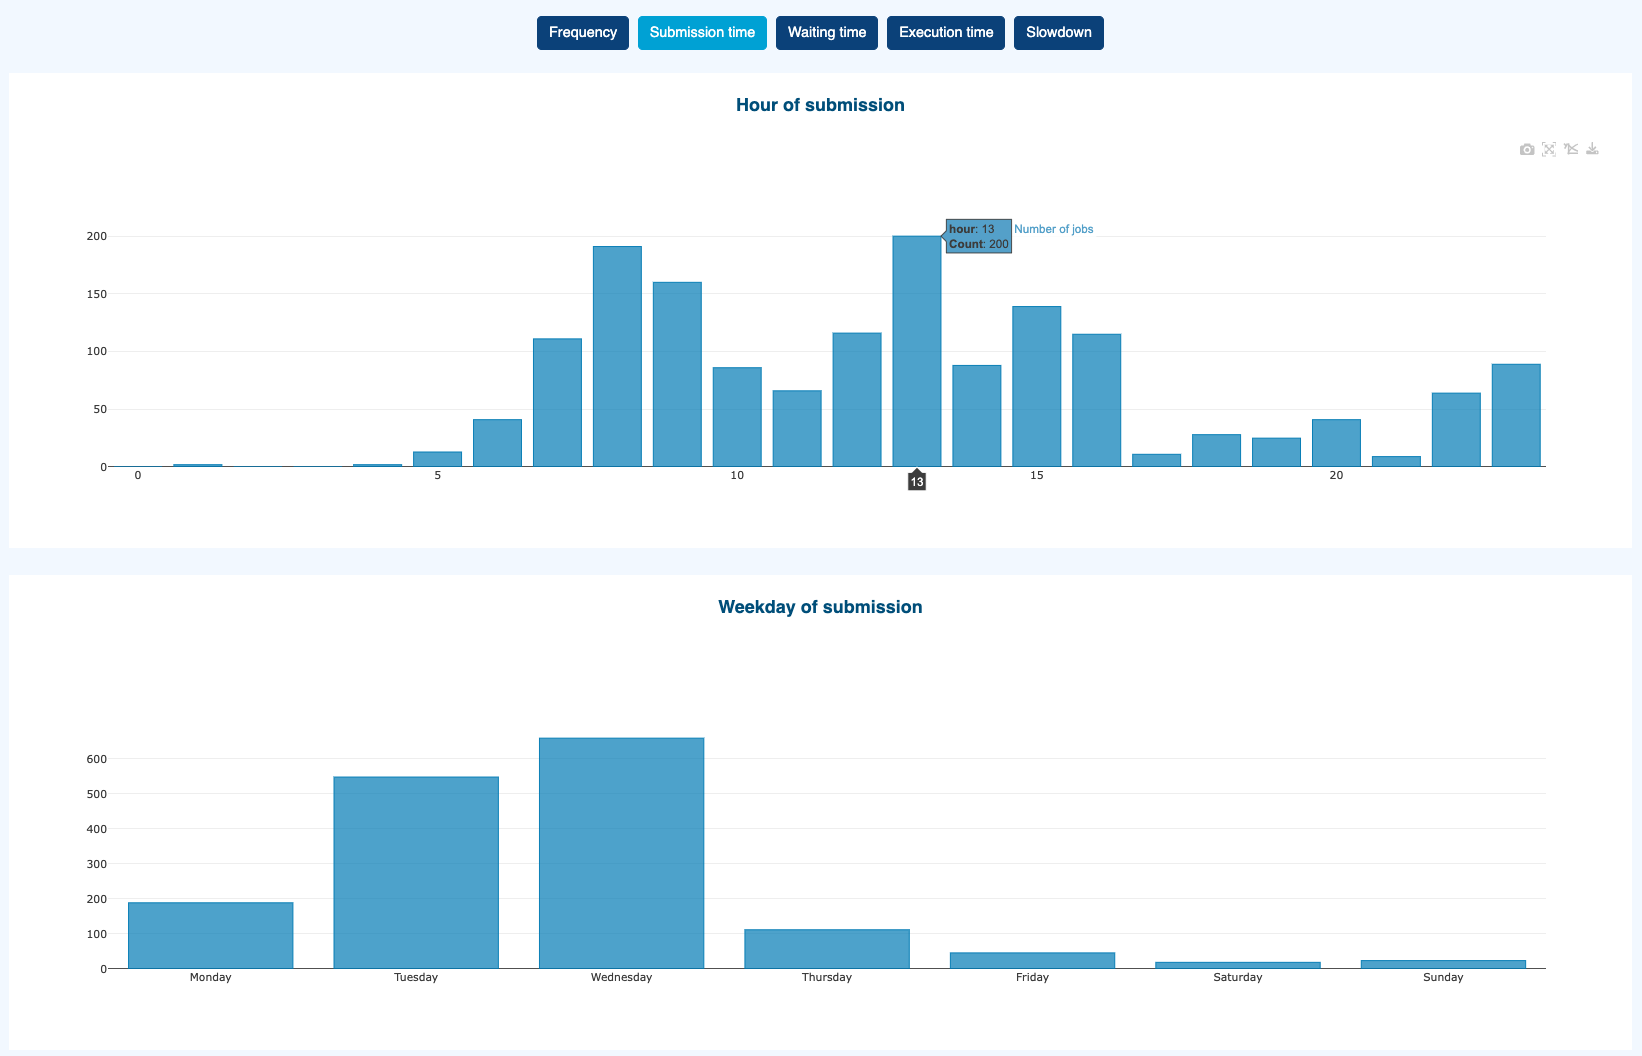
Job submission time
Job submission weekday
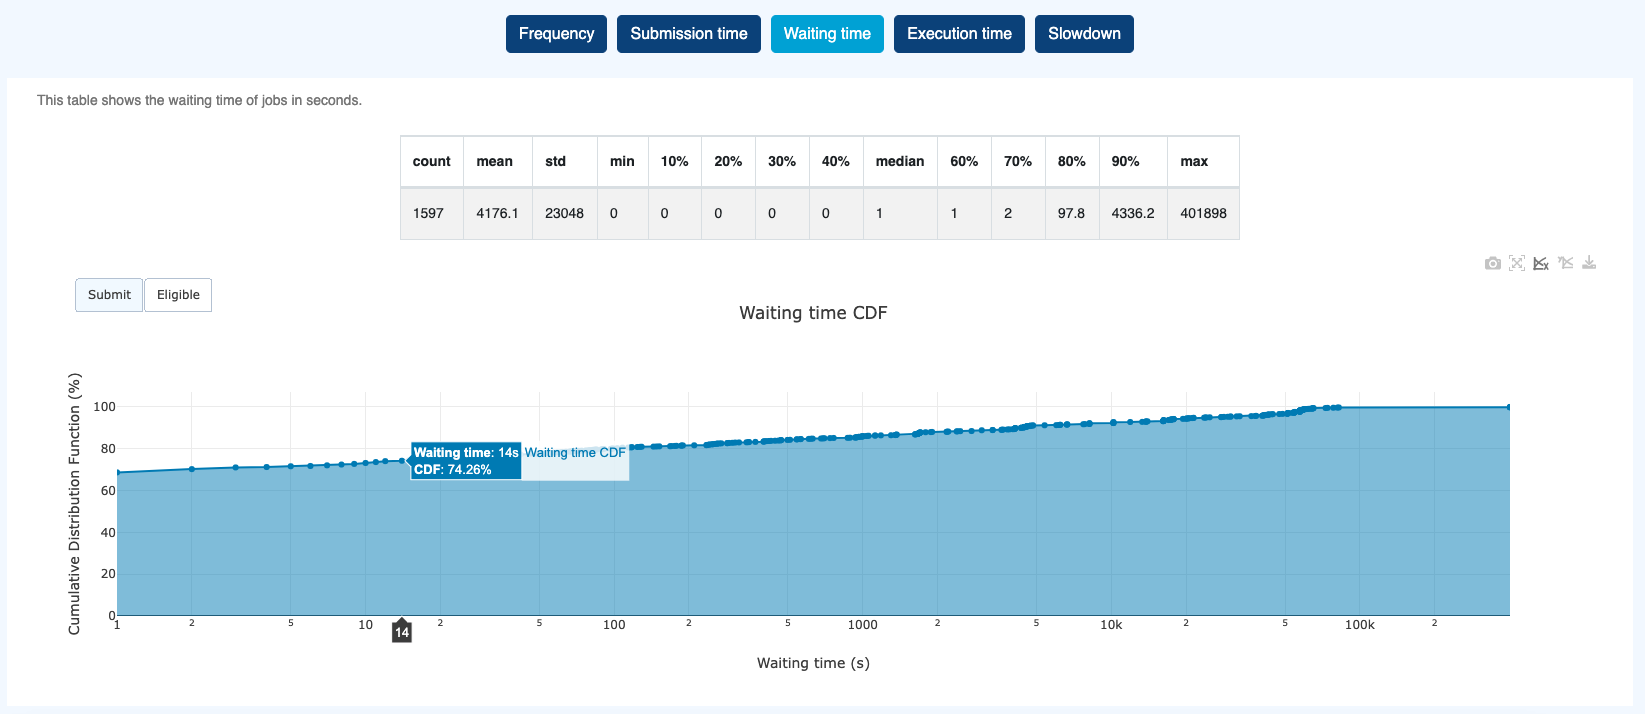
Waiting time of jobs in seconds based on either
SubmitorEligibledate.
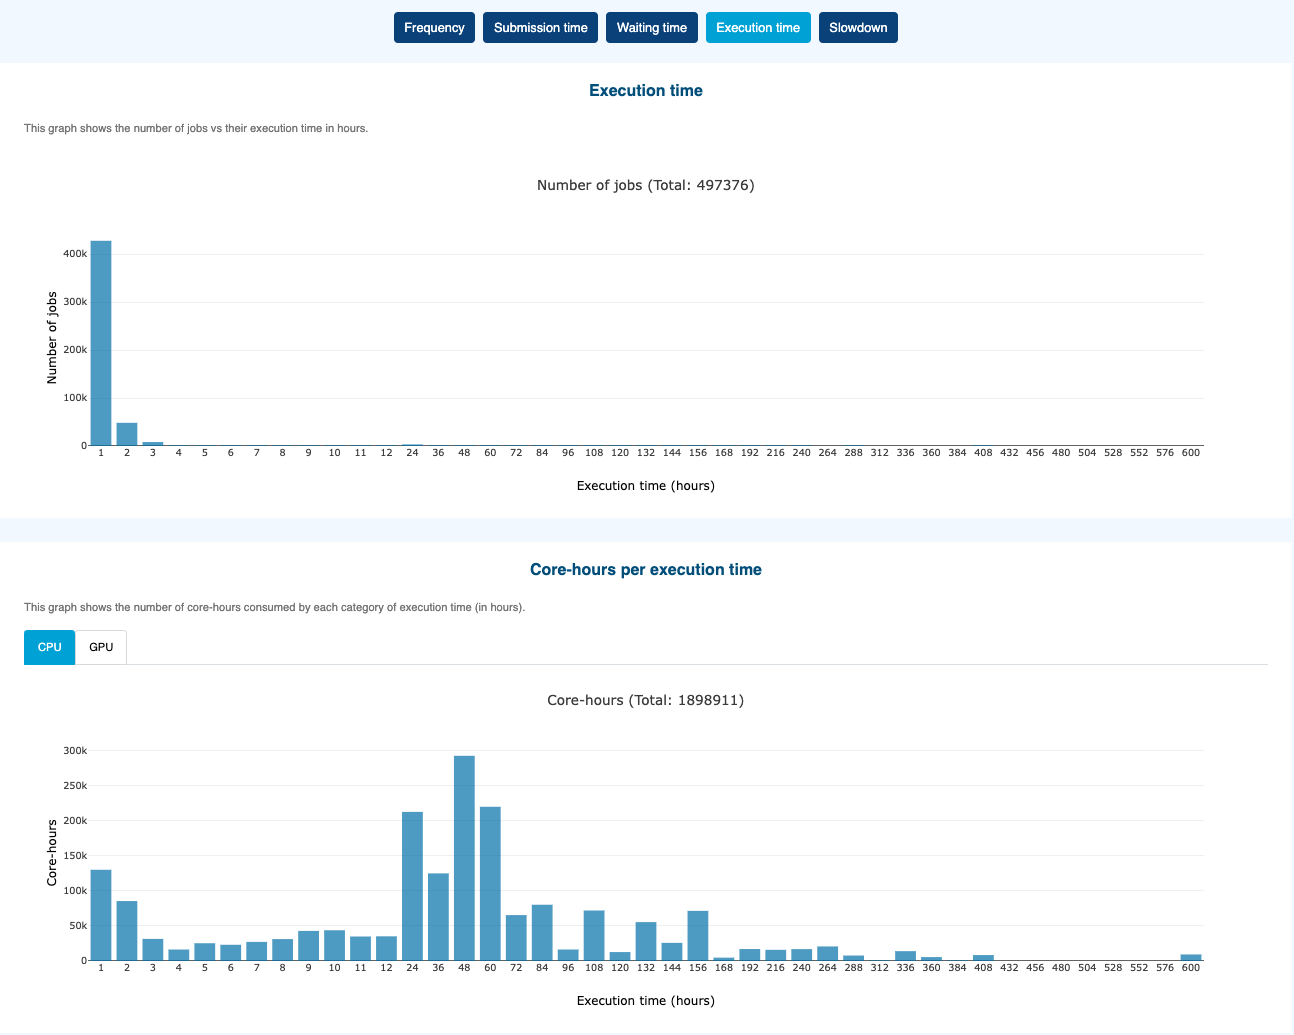
Execution time
Core-hours or GPU-hours per execution time. Integrated with tabs,
CPU (Core-hours)orGPU (GPU-hours)
Slowdown. This metric allows you to put into perspective the time jobs spend in queue vs. their execution time. Computation is based on either
SubmitorEligibledate.
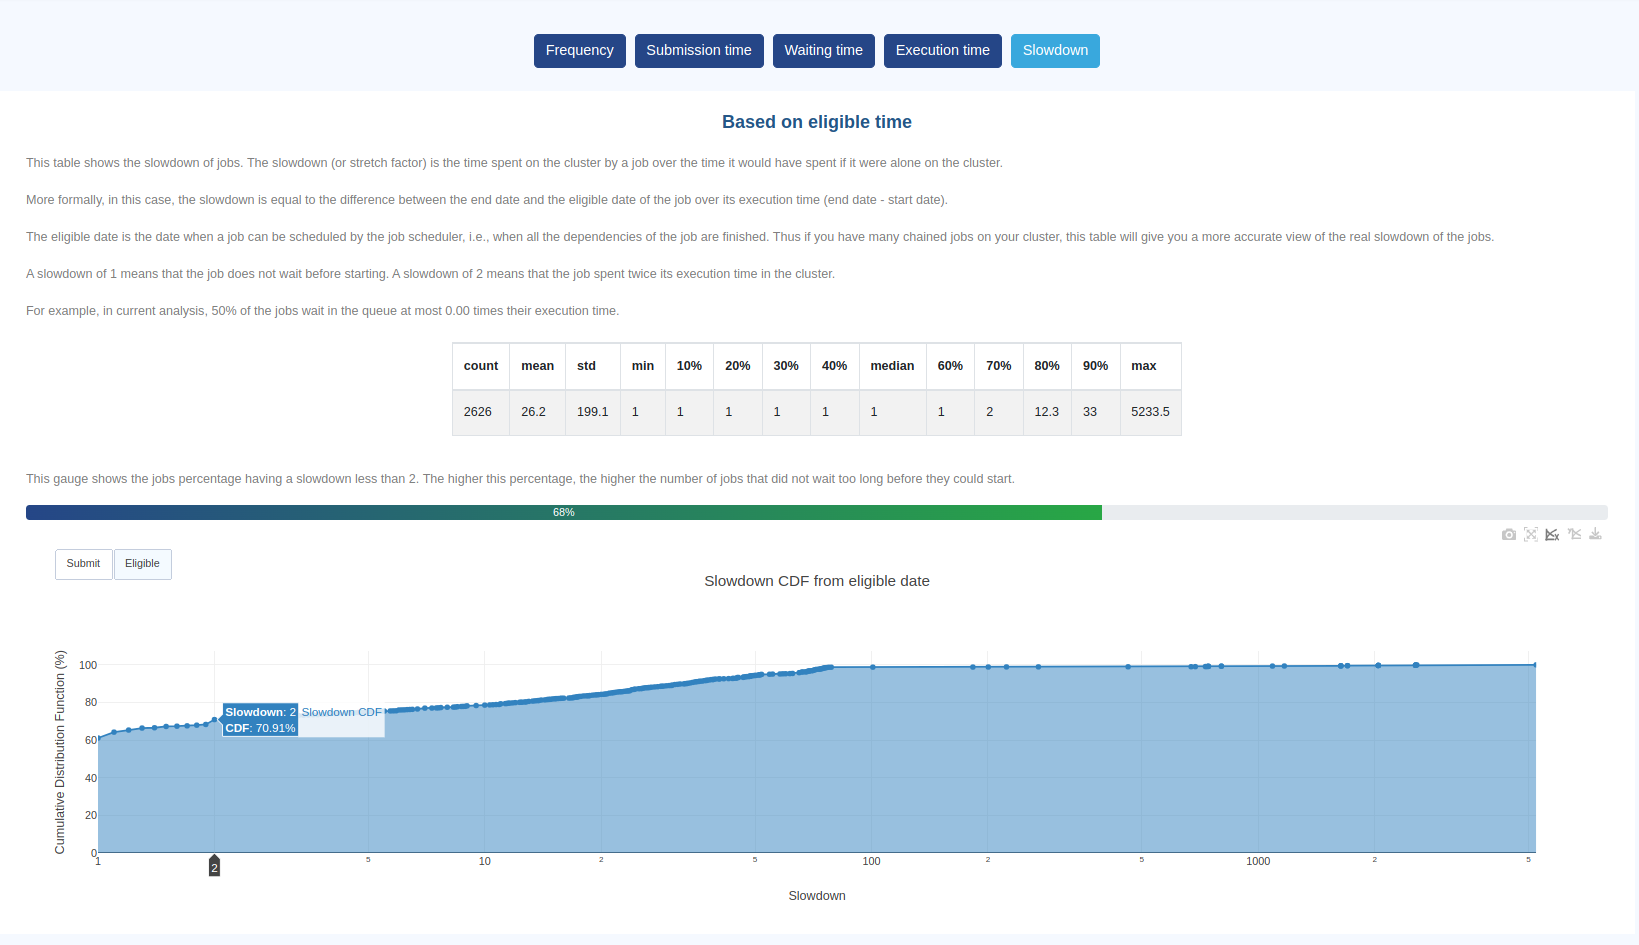
The Cumulative Distribution Function in this example shows that 70.91% of jobs had a slowdown <= 2 meaning that they wait at most as long as their execution time before they could start.
How it works
This section explains how to adjust the data visualization precision and select the reference date for the graphs.
Resolution Options
The precision for visualizing data can be adjusted using the buttons on the left of the graphs. These options determine the time period displayed.
by secondby minuteby hourby dayby month
When selecting by second or by minute resolution, the duration that can be visualized is limited to prevent requesting more data than can be displayed by the browser. In such cases, you can reduce the duration by applying filters based on job submission dates.
Date Reference Options
Depending on what the graph support, the reference date can be selected from the following options:
SubmitEligibleStartEnd
By selecting one of these options, the graph will display data based on the chosen reference date.