RackOON
Introduction
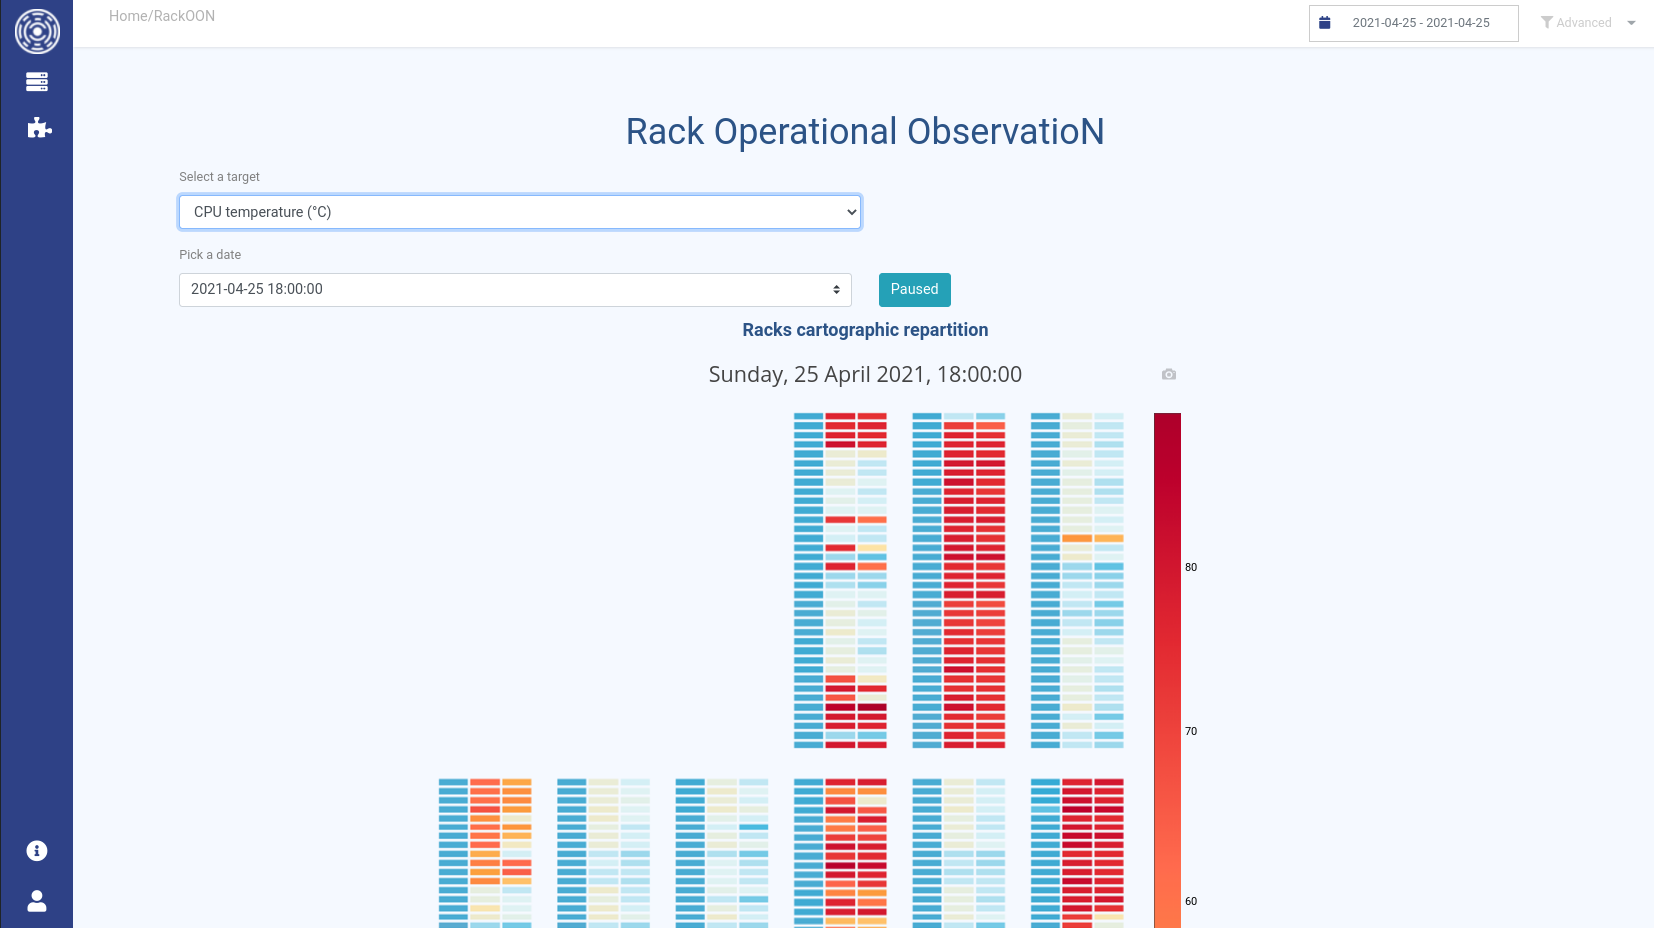
This plugin allows you to see the evolution in time of some specific metrics related to the nodes or CPUS of your cluster. Metrics available are CPU temperature and consumed power.
RackOON shows you the racks and nodes the way they are spatially arranged in the room.
How it works
You can configure the spatial disposition of your cluster in the administrator panel (see Cluster configurations).
To display the metrics, you need to choose a target using the dropdown box. You will then be able to
pick a specific date using the dropdown box or use the Play button to see the target evolution across all the available dates.
Use the date filter to choose a day on which to display the metrics.