Consumers
Introduction
This plugin groups the jobs based on similar features and displays statistical information about these groups. Available grouping features are:
Default features: Account, Application, Comment, GID, Group, JobName, Partition, UID, User, QOS and any other
stringcolumn kept in the databaseAdvanced features added to jobs using data enhancers during accounting logs ingestion (only features of
stringtype)
How it works
Select a category and a sub-category on which to aggregate the jobs.
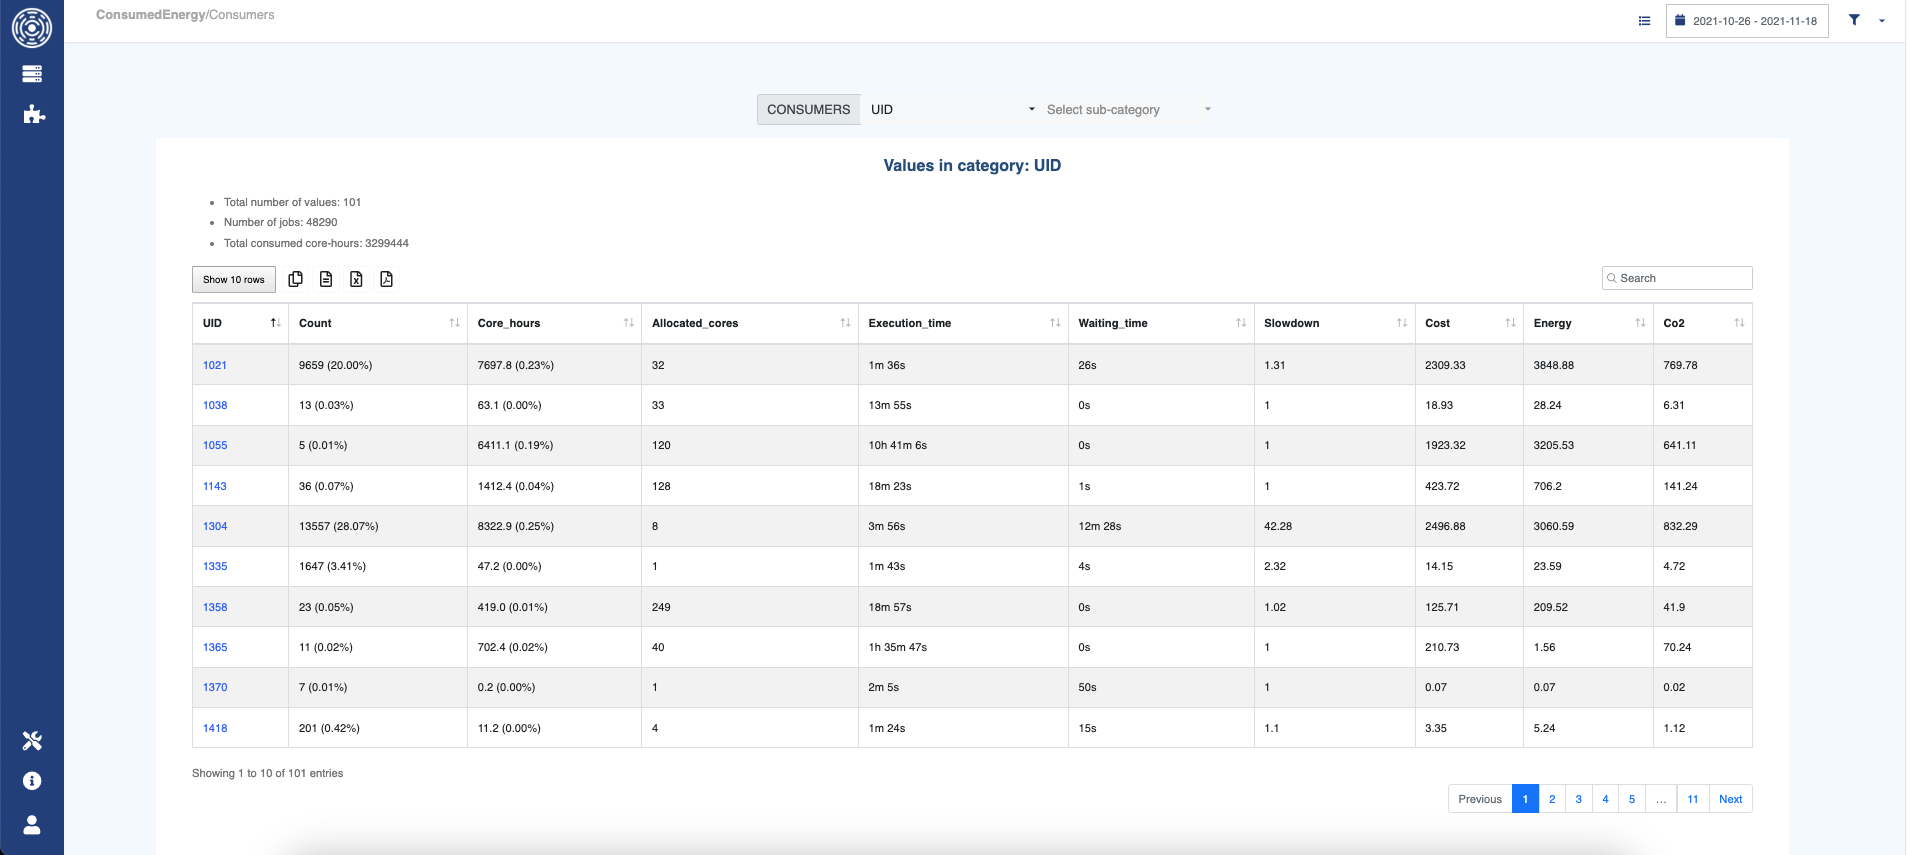
The generated table shows for each group:
the maximum number of allocated CPUs (Allocated_cores)
the maximum execution time (Execution_Time)
the total consumed CPU hours (Core_hours)
the number of jobs (Count)
the average waiting time (Waiting_Time)
the average slowdown (Slowdown)
the total cost (Cost) in currency as set in the configuration (see Interface configuration)
the total consumed energy in kWh (Energy)
the total carbon footprint in kg CO₂e (CO₂)
This plugin allows you to get the cluster consumption for each user for example.
You can then order the users by clicking on a column name (Core_hours for example) to spot the bigger consumers.
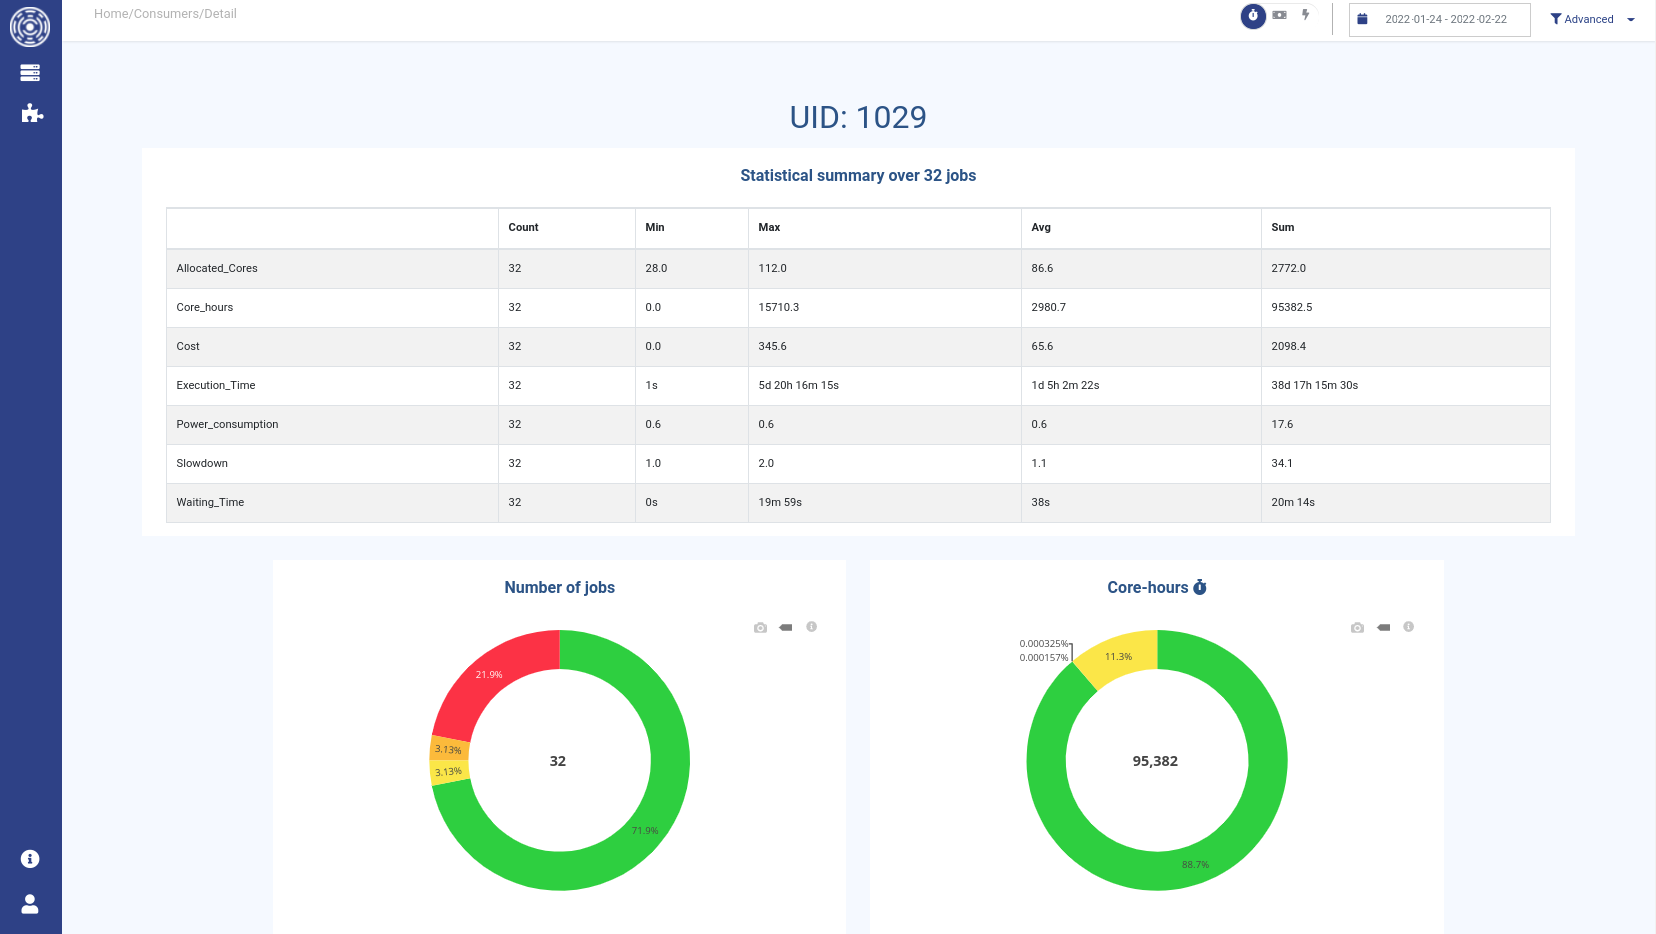
You can click on each group in the table to get more detailed statistics about the above-mentionned variables and its jobs status distribution (see State key metrics for more details).