Load
Introduction
This plugin displays the cluster load and occupancy through time.
The tables show basic statistics on the computed metrics.
Key metrics
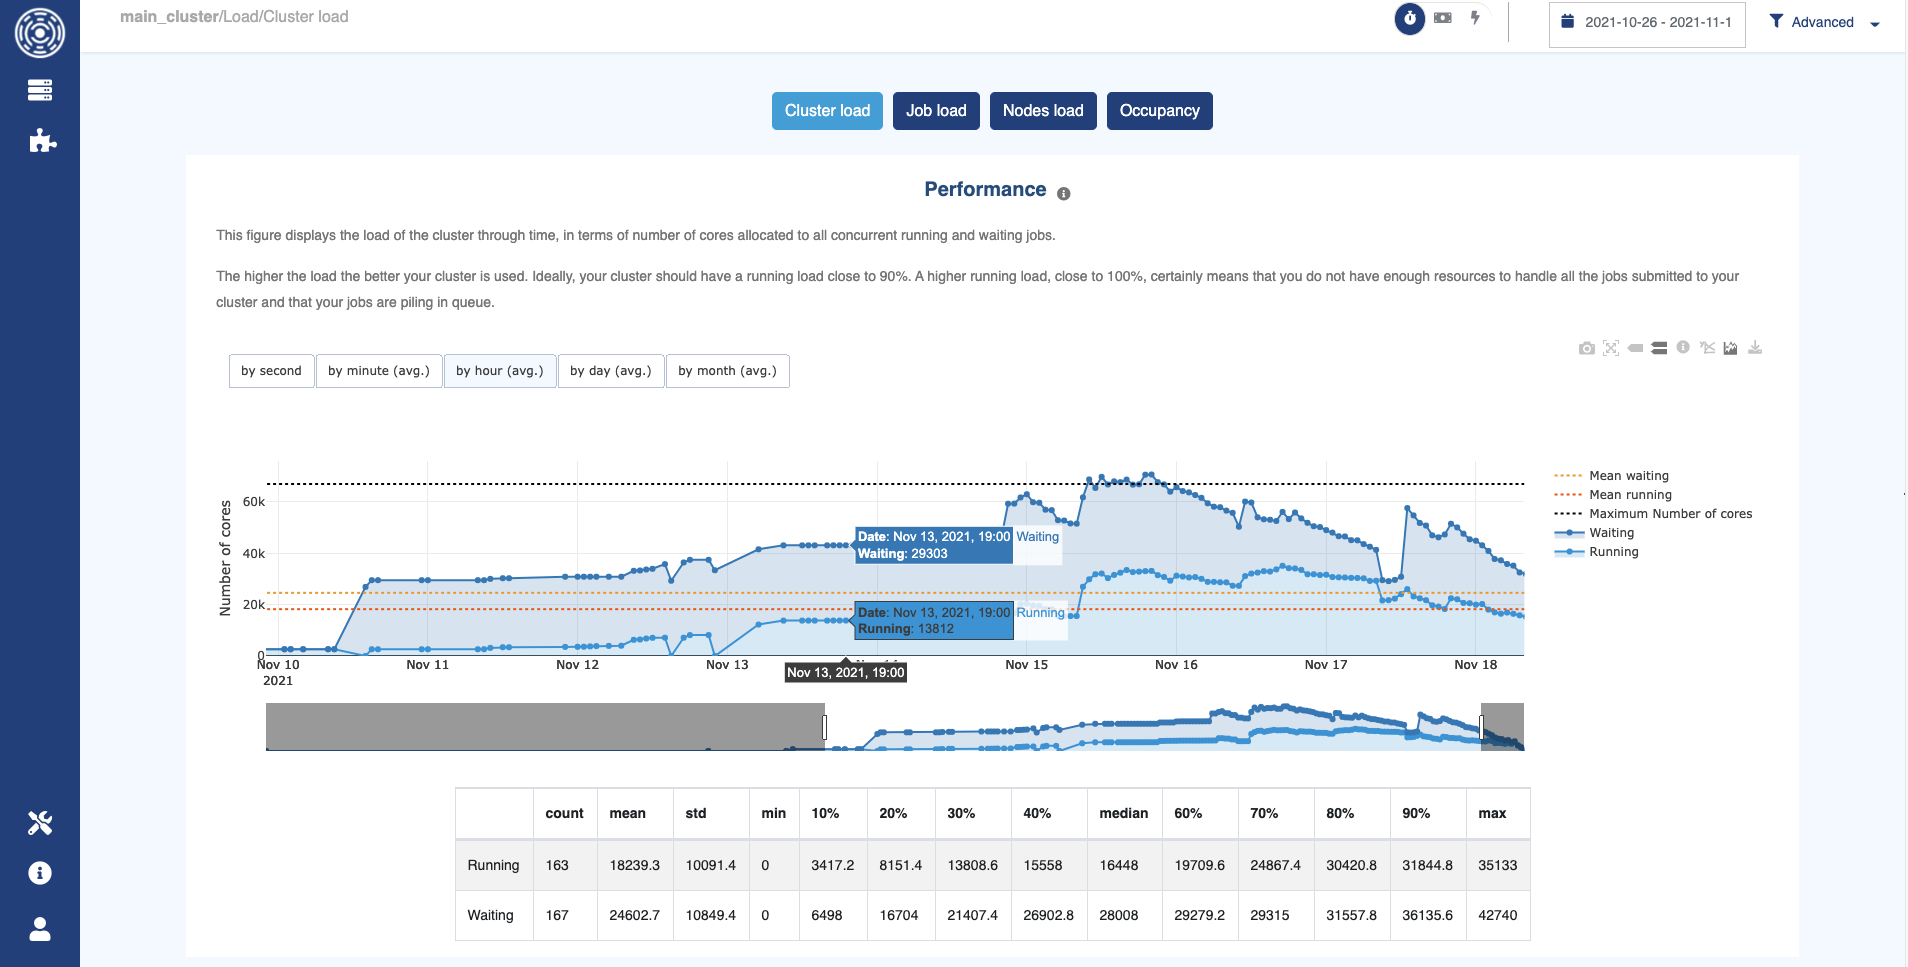
Cluster load:
Switch per categories:
Performance: Running (allocated) and waiting (requested) cores mean values, on a prorated basis for the selected resolution.
Power: The mean power consumption of all running jobs.
Jobs with a waiting / running duration equal to 0 are not included in the corresponding waiting / running results as we consider they had no impact.
Job load:
Number of running and waiting jobs.
Job with a duration of 0 are included in the results.
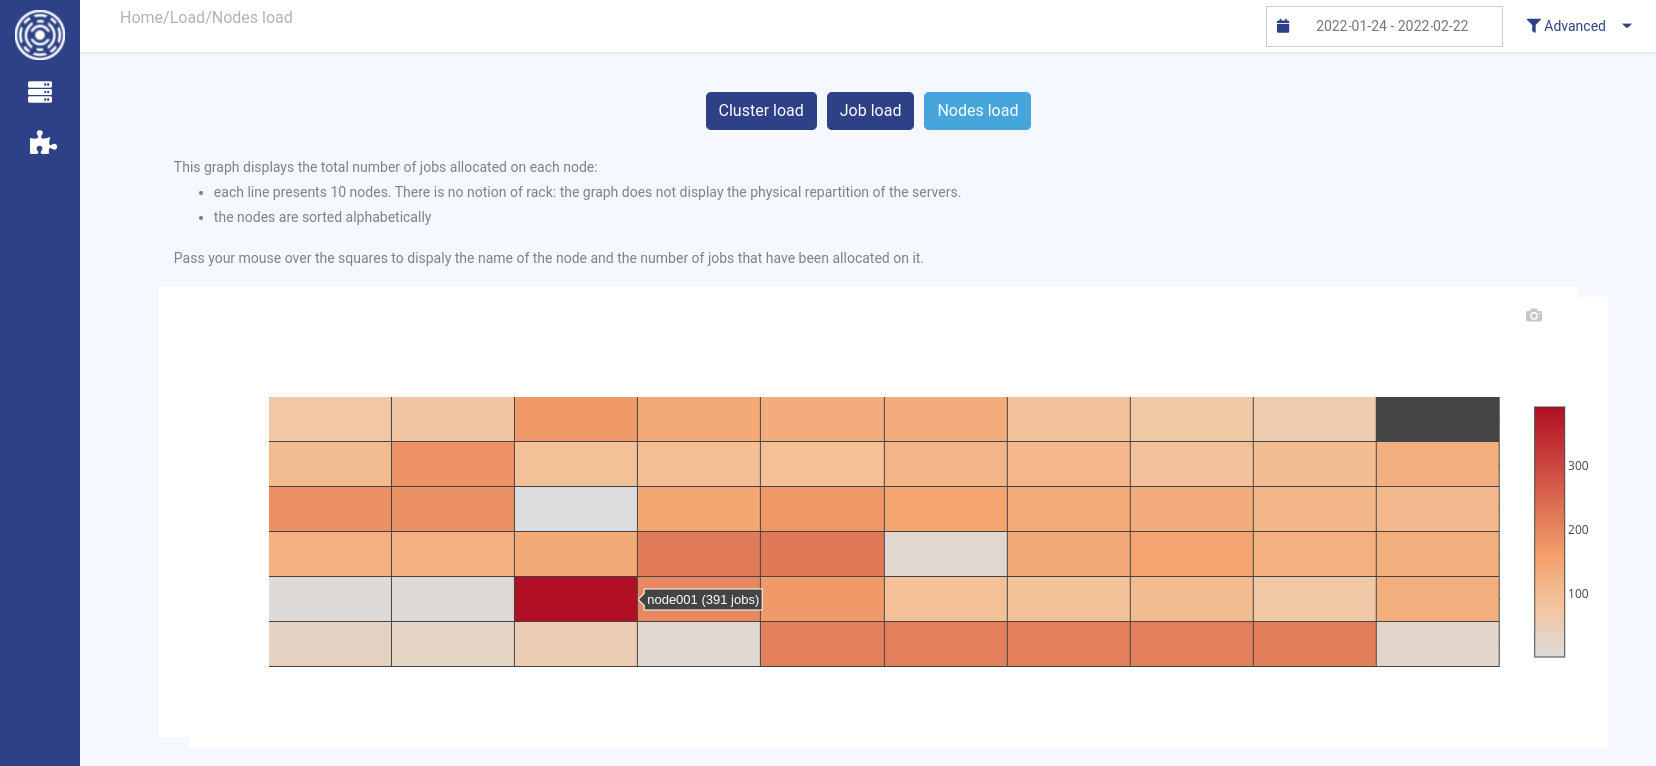
Number of jobs per node. This allows you to spot the most used nodes.
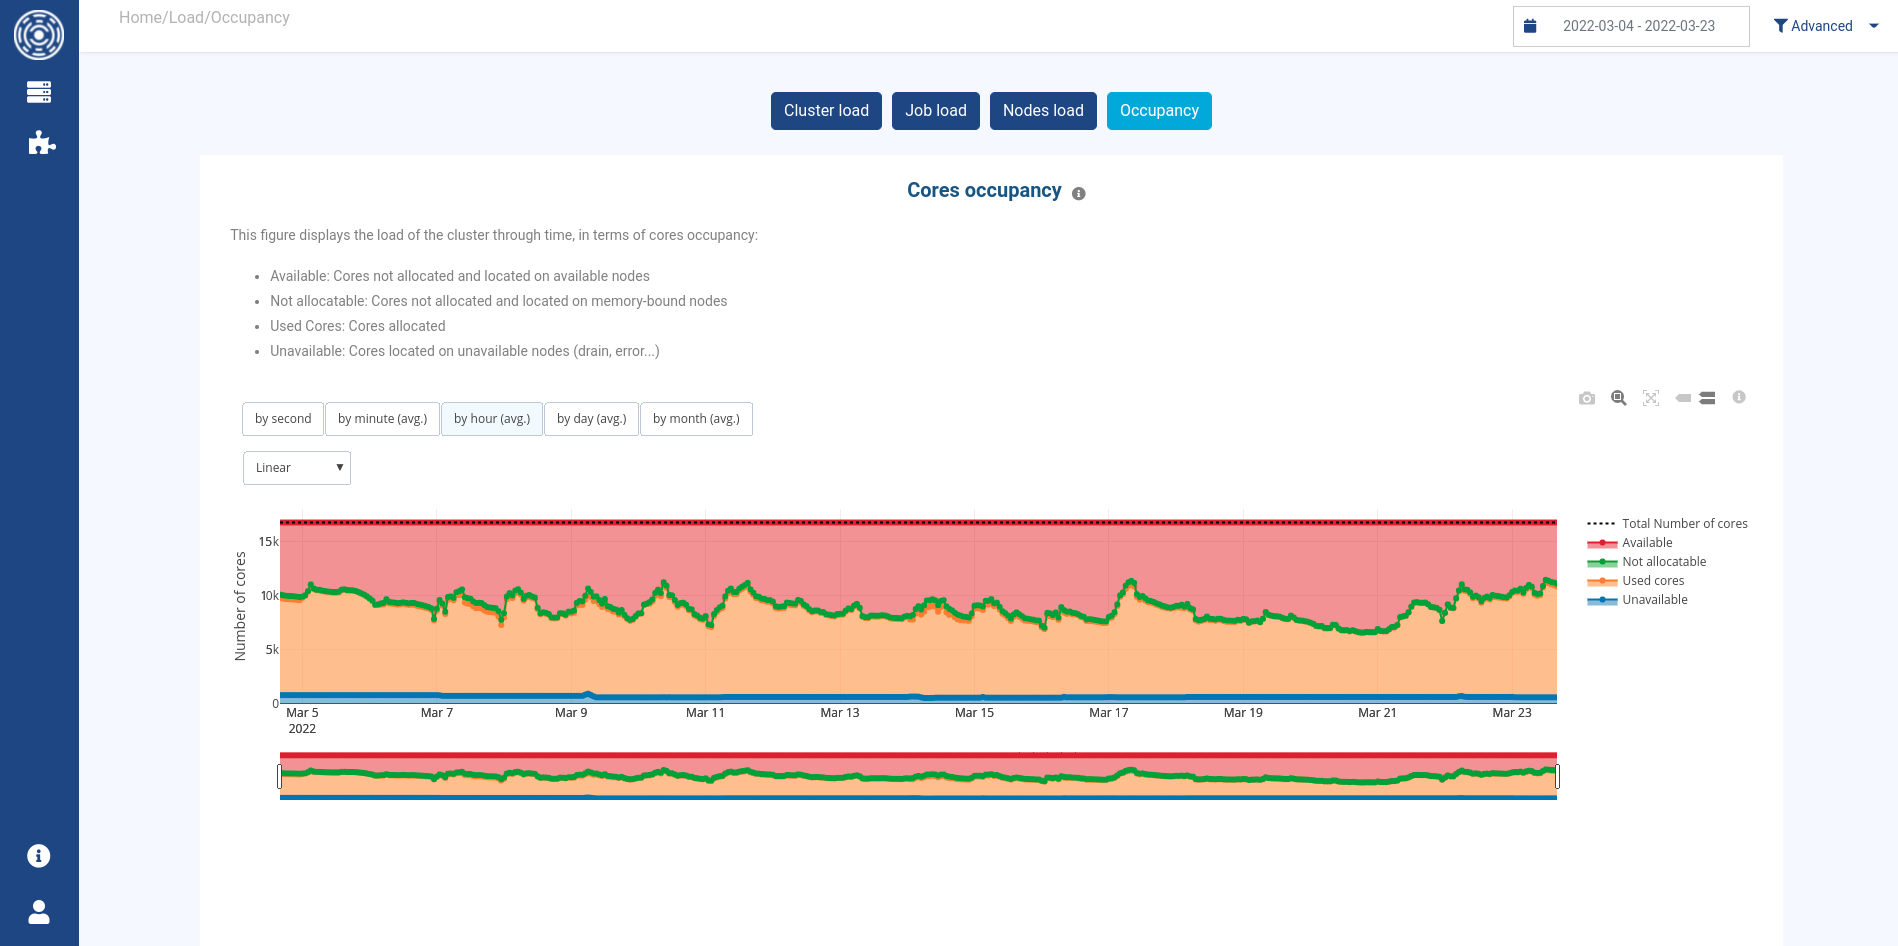
Cores and nodes occupancy. This allows you to spot memory-bound nodes (nodes with unused cores that are not allocatable because all the node memory has been allocated).
How it works
You can change the precision used to aggregate the load using the buttons on the left of the graphs
(by second, by minute, by hour, by day, by month).
Load values are mean values over each of the periods of the selected resolution.
When using by second and by minute, you will be limited on the duration to visualize to avoid requesting more data than what can be displayed by your browser.
In these cases, you can reduce the requested duration by using the filters on jobs submit dates.