Meteo Cluster
Introduction
This plugin allows you to get predictions on multiple timeseries for the next week, month, quarter or year
at the hour, day, week or month precision.
Depending on the consumption switch, available target timeseries are:
- When the consumption switch is set on
Performance: The number of jobs in queue
The cluster load for running jobs
The cluster load for running jobs relatively to the total cores number of the cluster
- When the consumption switch is set on
- When the consumption switch is set on
Cost: The jobs-related cost
The cost related to your Cloud consumption (
Budget editiononly)
- When the consumption switch is set on
- When the consumption switch is set on
Power: The jobs power consumption (
Energy editiononly)
- When the consumption switch is set on
How it works
The models training occurs in backend and you can then see the training metrics and ask for predictions using MeteoCluster plugin in OKA interface.
During each training, a new model will be trained using the most recent logs.
You can define the amount of data to keep as test in the administrator panel (see Meteo Cluster - Conf). Default is the period to predict.
Upon successful training, the test dataset will be used to update the model following an online learning procedure.
This way, the model will be updated on the most recent data available and ready to predict the future unseen period.
Before training, you must first configure/modify a MeteoCluster pipeline in the administrator panel. For each prediction pipeline, you have 2 configurations to make:
the pipeline configuration (see Conf pipelines). Using this configuration, you can filter the input jobs used to train the models.
the MeteoCluster configuration (see Meteo Cluster - Conf). Using this configuration, you can modify the training and algorithm parameters. You can chose if you want to optimize the model hyperparameters, which algorithm to use…
Meteo Cluster training is then triggered using OKA scheduler. You can see the status of the training pipelines in the administrator panel (see Periodic Tasks). If needed, you can also manually trigger a training using this panel.
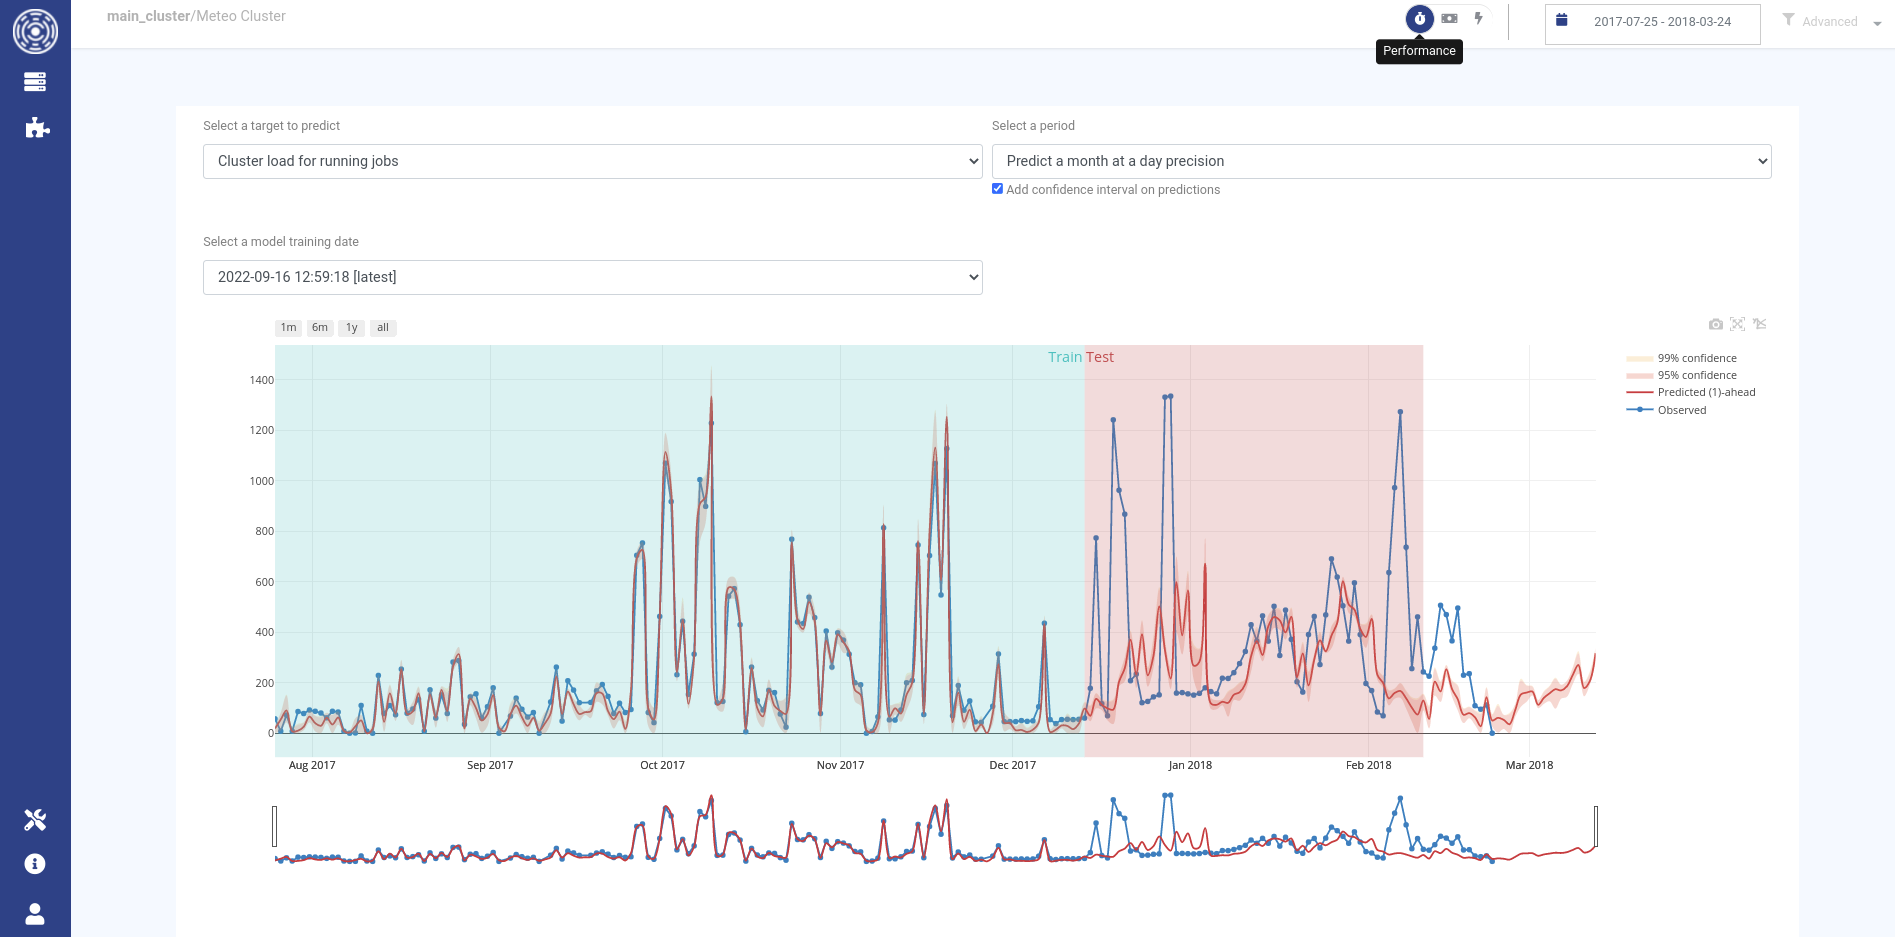
The displayed graph
When the training is completed, you will be able to see the predictions for the past and next periods using OKA interface.
The lines displayed on the main graph show the observed values in blue and the predictions in red.
Predictions are computed n steps ahead depending on the Pred seq parameter in MeteoCluster configuration.
Default is 1 step ahead (1)-ahead, i.e. the observed values until the n-1 step will be used to predict the nth step.
Observed values used for training and testing are highlighted by the light blue and red areas, respectively.
If new logs have been ingested since the last training, observed values will be observed after the testing period.
Use the date filter to select the period during which you would like to retrieve the observed values. You can add the confidence intervals on the predictions using the checkbox (available only for LSTM algorithm). You can choose to display the predictions for an older model by choosing another training date in the corresponding dropdown list.
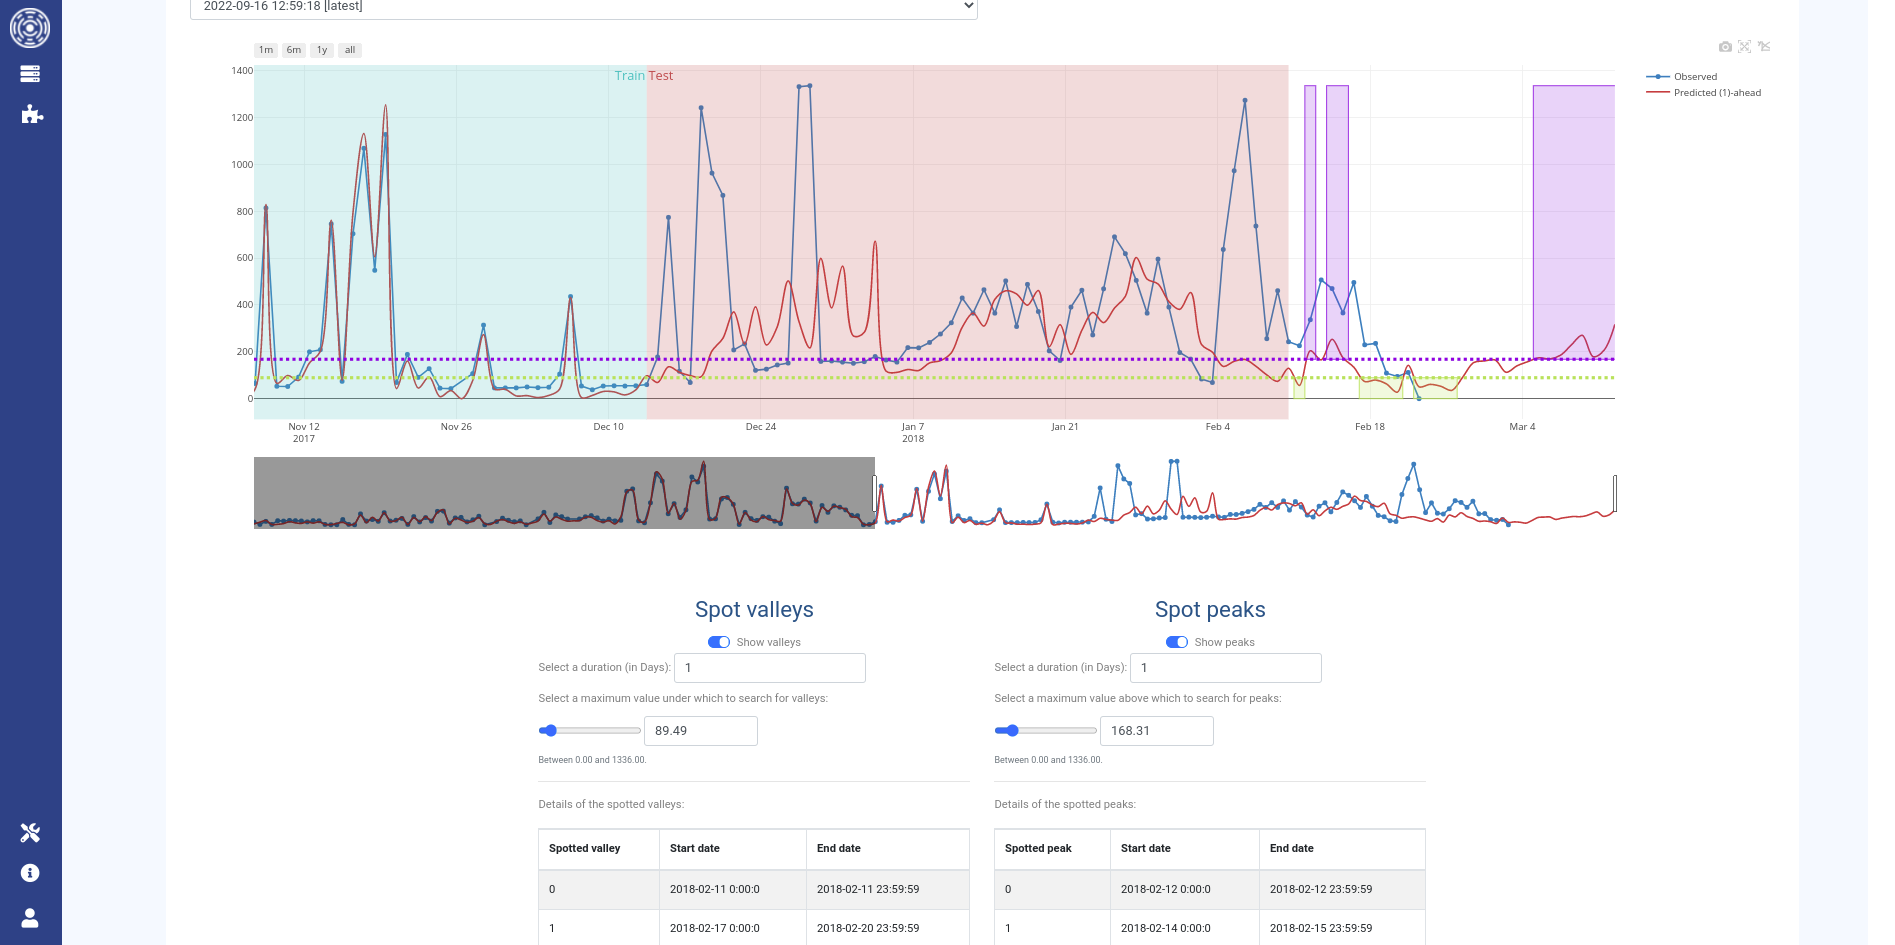
Post-processors
A post-processor allows you to spot peaks and valleys on the future predictions based on a target threshold for a specific duration. Using this tool, you will be able to:
Spot in the future when your cluster will be less used to plan a maintenance period
Spot in the future when your cluster will be overloaded to anticipate the users needs
Metrics
You will have access to the training metrics using the See train & test metrics.
Test metrics
Predictions accuracies on the test dataset are evaluated using 3 metrics:
R2: Coefficient of determination in percent. It shows how well observed values are replicated by the model. The higher the R2, the better the predictions.
RMSE: Root mean squared error. It measures the differences between values predicted by the model and the values observed. It is in the same unit than the predicted target. The lower the RMSE, the better the model.
rRMSE: Relative Root mean squared error. It is the RMSE normalized by the mean observed values. It is expressed in percent. The lower the rRMSE, the better the model.
The metrics history shows the evolution of those accuracy metrics along time (each point is related to 1 training date).
Train metrics
The training details show metrics about the jobs used to train and test the model.
If available, the parameters used by MeteoCluster and by the algorithm can be displayed using the Parameters used for training button.
Depending on the algorithm used, the interface will display different information about the trained model:
If
LSTM: The features used to train the modelIf
NeuralProphet: The forecast components used by the model
The next graph shows the hyperparameters used by the model. If optimization of the hyperparameters has been done, it will display the Mean Squared Error associated to each hyperparameters set.
The last graph is the evolution of Train and Validation losses along epochs.
Training procedure
MeteoCluster is pre-configured to train automatically, however it is also possible to manually train the models. During a manual training, you will train a model iteratively to find the best parameters combination to maximize your predictions accuracies.
To do a manual training, you must follow this procedure:
In the admin panel, modify the training parameters in
METEO CLUSTER > Conf meteo clustersfor the concerned pipeline, for example:
Algorithmsif you want to change the algorithm used by default (LSTM).Select
Epochs autoif you want to optimize the number of epochs used to train the algorithm. During epochs optimization MeteoCluster will monitor the validation loss to stop model training upon its decrease. The minimum number of epochs is 10% of the number of epochs set in the configuration.Modify
N lagsto configure the number of timesteps in the past to consider to make the next forecast. For example, using 14 asN lags, the model will use a sequence of 14 timesteps to predict the 15th one.Modify
Pred seqto set how much steps ahead must be considered to make the predictions. For example, using 2 asPred seq, the model will try to predict 2 steps ahead. If we keep the example used forN lags, it will predict the 16th timestep instead of the 15th.Once you have updated the training parameters, trigger the model training using the
RUN NOWbutton in thePERIODIC TASKS > Periodic taskspanel (see Periodic Tasks). In this panel, you will be able to follow the training status. A successful task means that the training has ended.Go to
OKA interface > Meteo Clusterto see the past and future predictions, and the associated training metrics.Use the training history to spot the best accuracies. The hover will show you the training date of the model for each point. You can then display the metrics and parameters used for this model using the dropdown list on training dates.
Repeat the previous steps to find the best parameters combination.
Some hyperparameters of the model can be automatically optimized when checking Optimize in the Advanced options
of MeteoCluster configuration.
By default 100 hyperparameters combinations will be tried. This will then take a long time to compute.
The result of the optimization will be displayed in the Train metrics.
The best combination, minimizing the Mean Squared Error, will be used to train the model.
Check Previous hyperparameters and uncheck Optimize if you wish
to use an optimized combination of hyperparameters for the following trainings.
You may also modify MeteoCluster configuration to set those hyperparameters.