Congestion
Introduction
This module shows the cluster state (Optimal, Underutilized, Contention, Congestion) through time, and jobs life cycle.
Optimal: The users are not waiting too much and the cluster is well loaded
Underutilized: The users are not waiting too much and the cluster is under-used
Contention: The users are waiting for too long and the cluster is well loaded
Congestion: The users are waiting for too long and the cluster is under-used
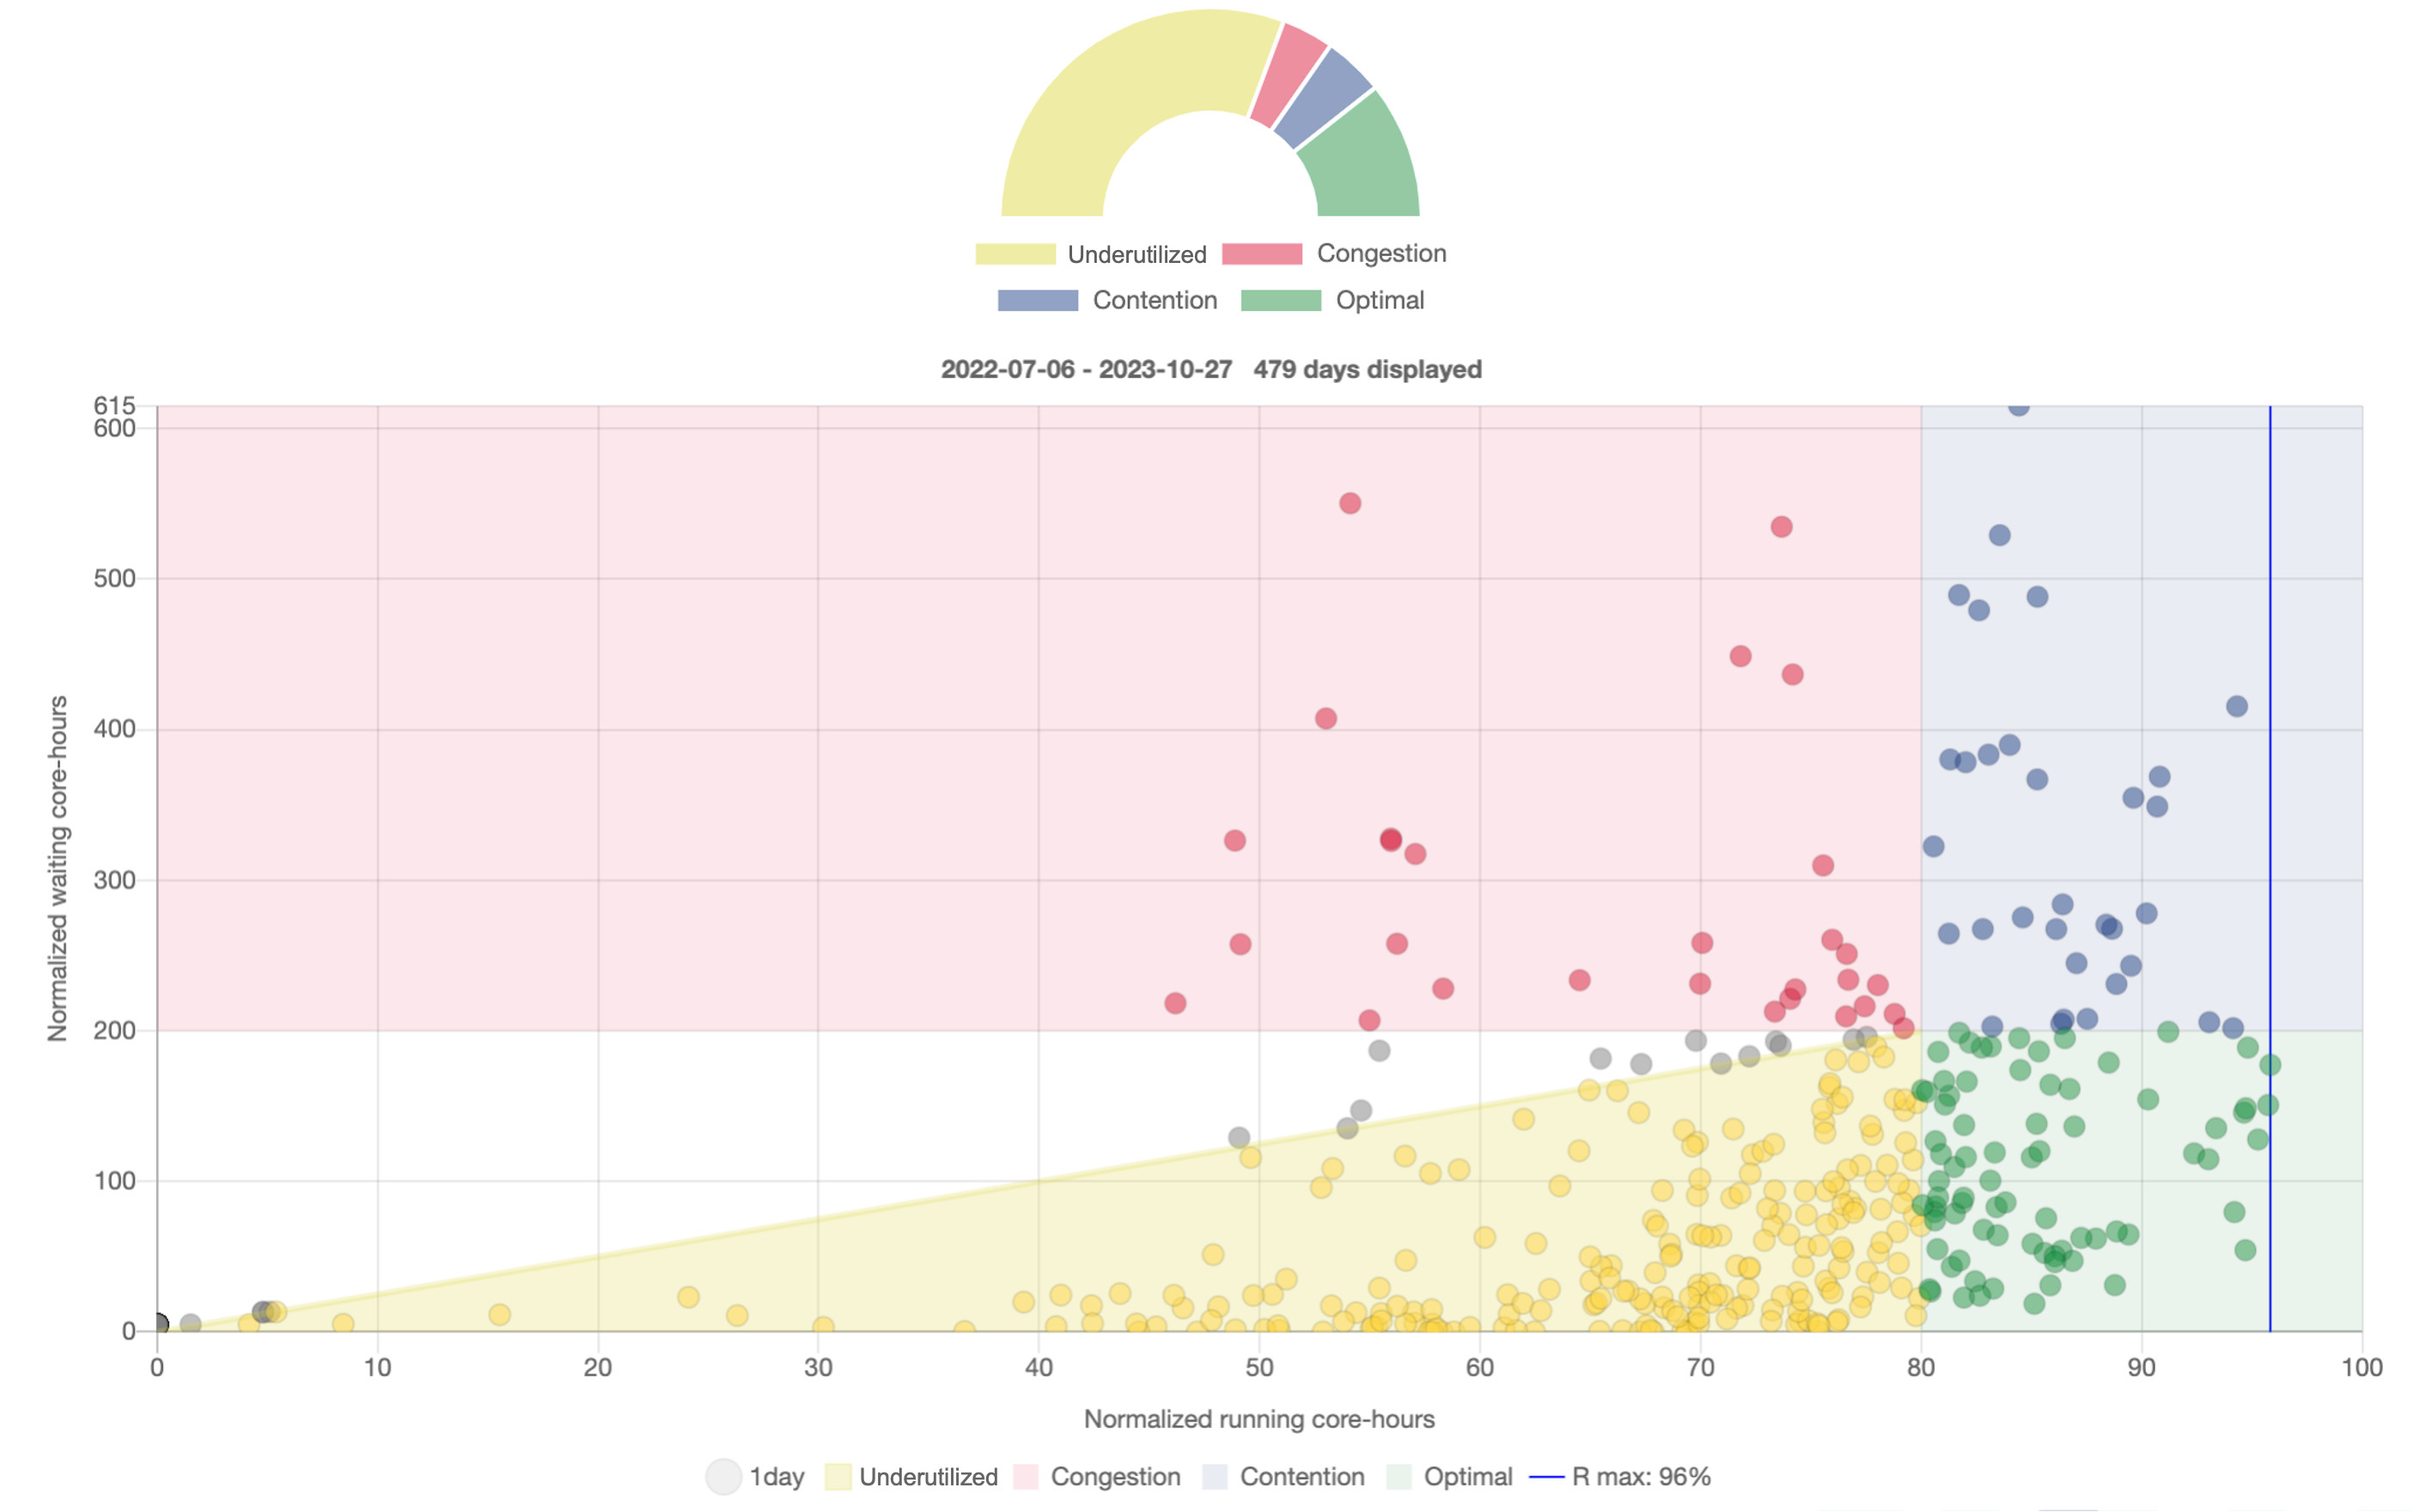
The X-axis shows normalized running core-hours, ranging from 0 to 100 percent, where 100 percent represents full utilization of available cores per resolution tick.
The Y-axis shows normalized waiting core-hours, starting from 0 and increasing upward, where values represent how many cores were queueing relative to the available cores per resolution tick.
Both axis shows core-hours per day relative to available cores on that day.
Warning
If your cluster configuration is set to 0 when it comes to the number or cores or GPUs available, you might end up seeing points presenting you with a R:0 , W:101.
This will be the case when you have jobs in queues at a period where no resources where set as available in the cluster.
For those particular cases, we will consider that 101% of the cluster resources are requested by the jobs.