Resources
Introduction
This module displays resource consumption.
Key metrics
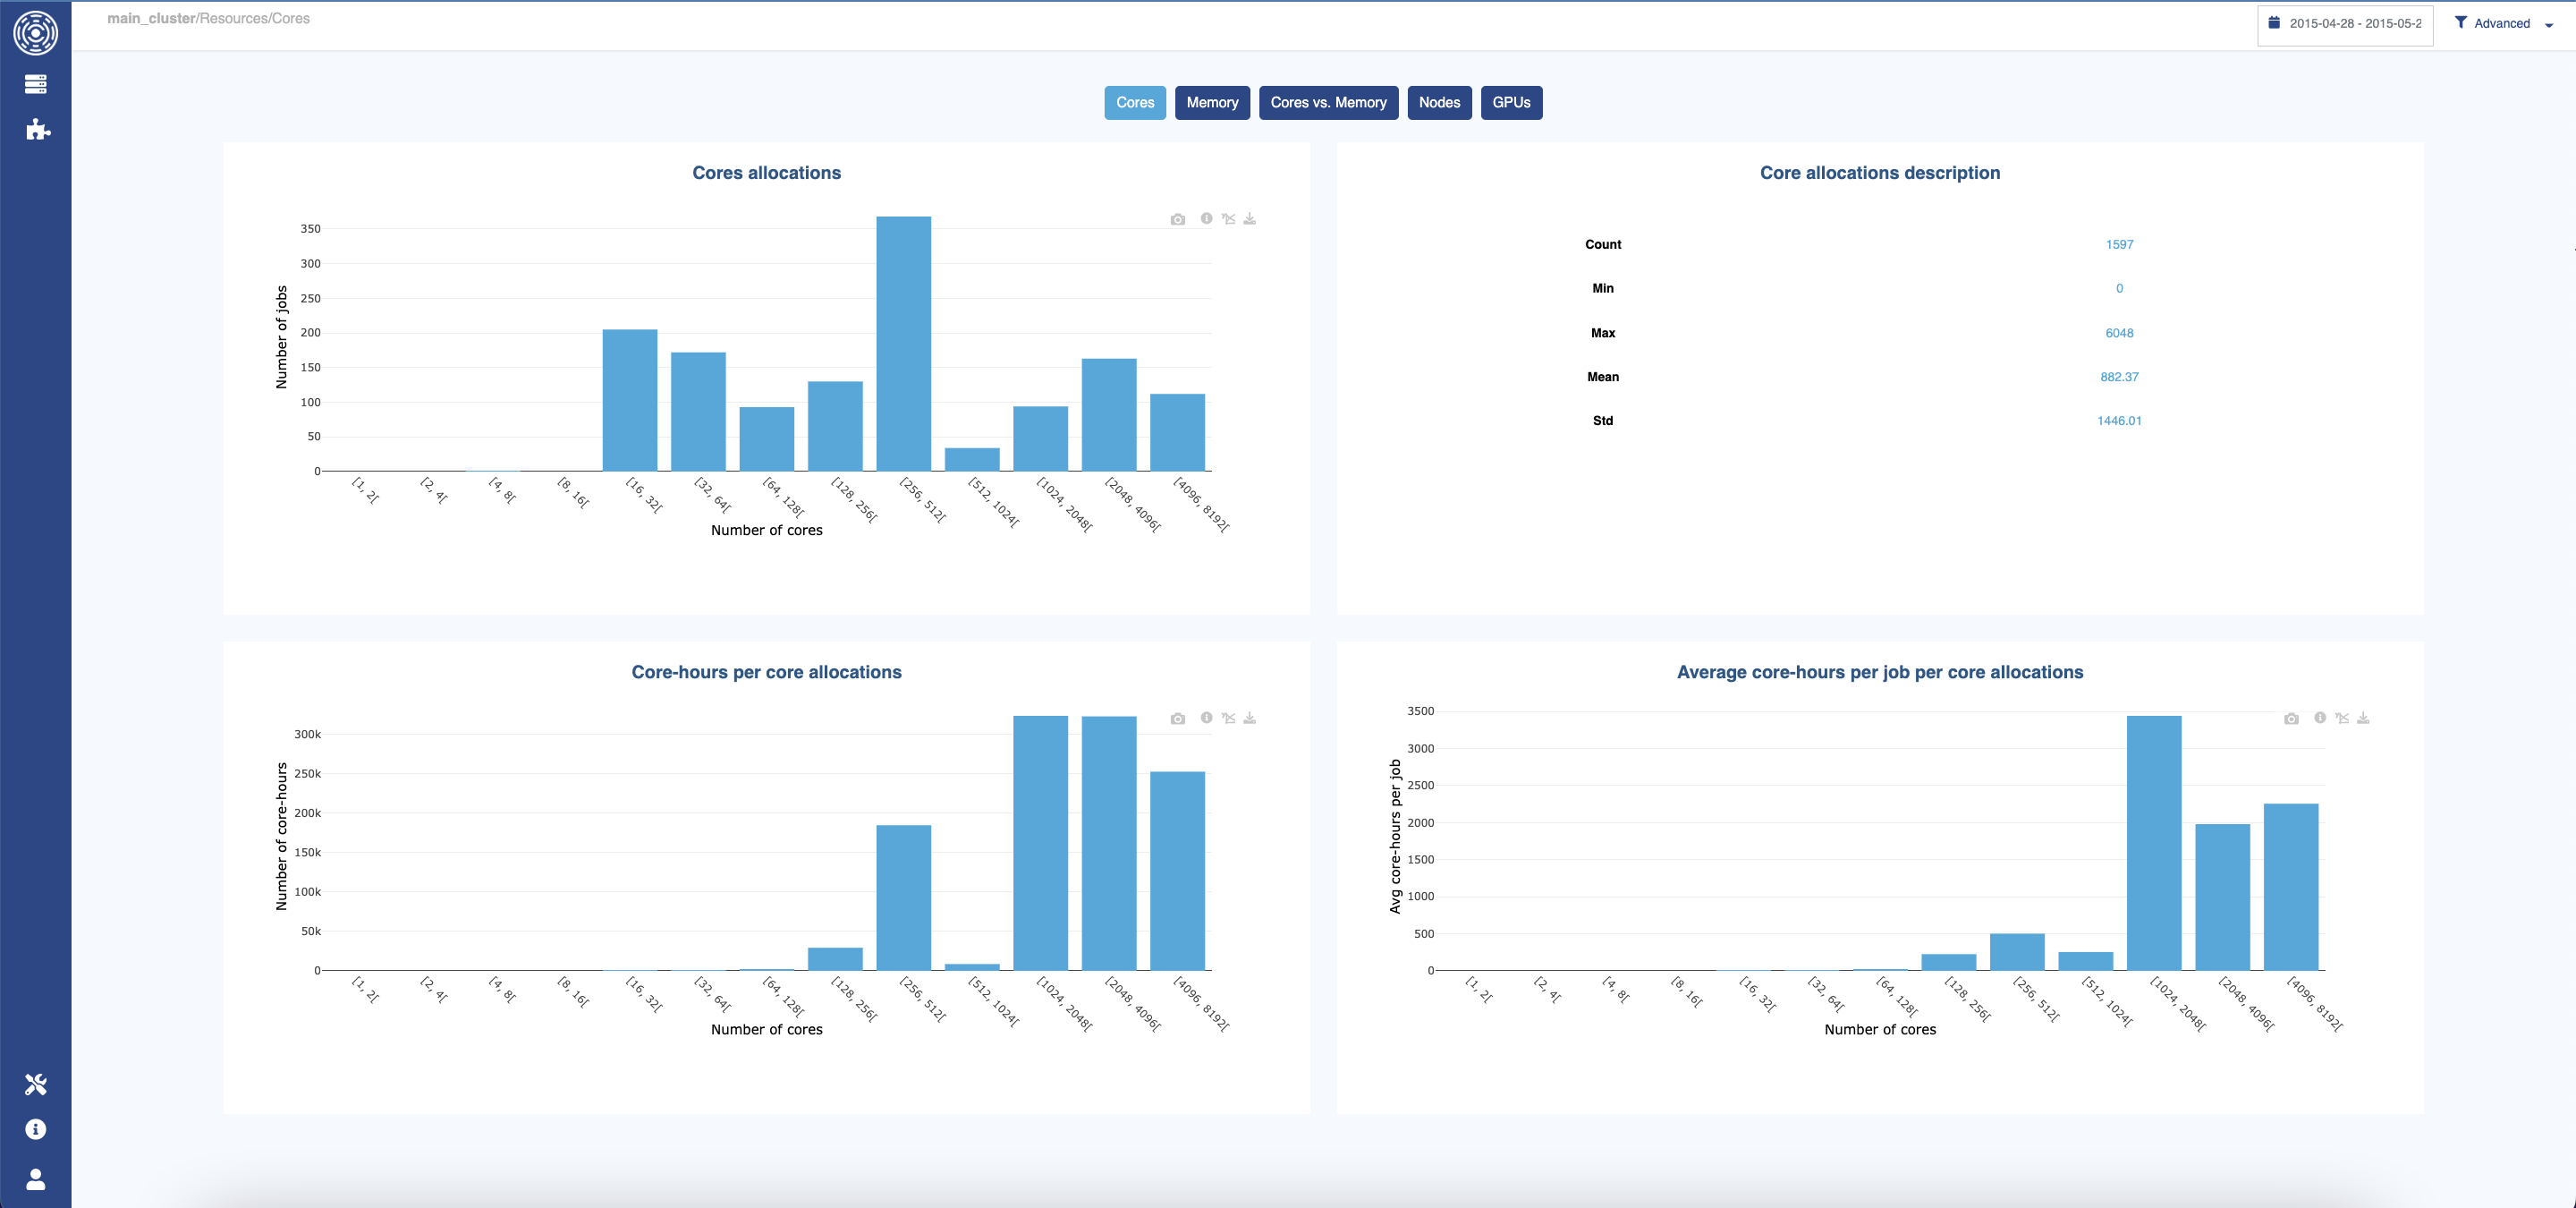
Number of cores, nodes and GPUs allocated
Requested and consumed memory
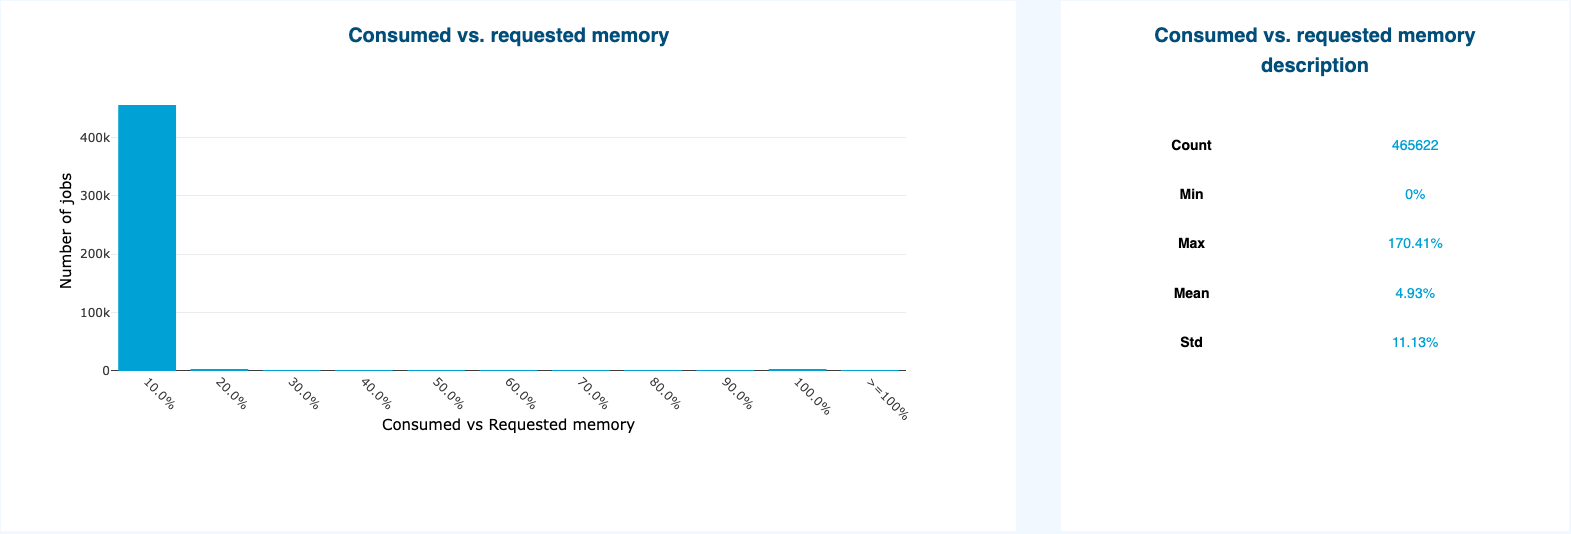
This example shows that most of the jobs consumed less than 10% of the memory they required.
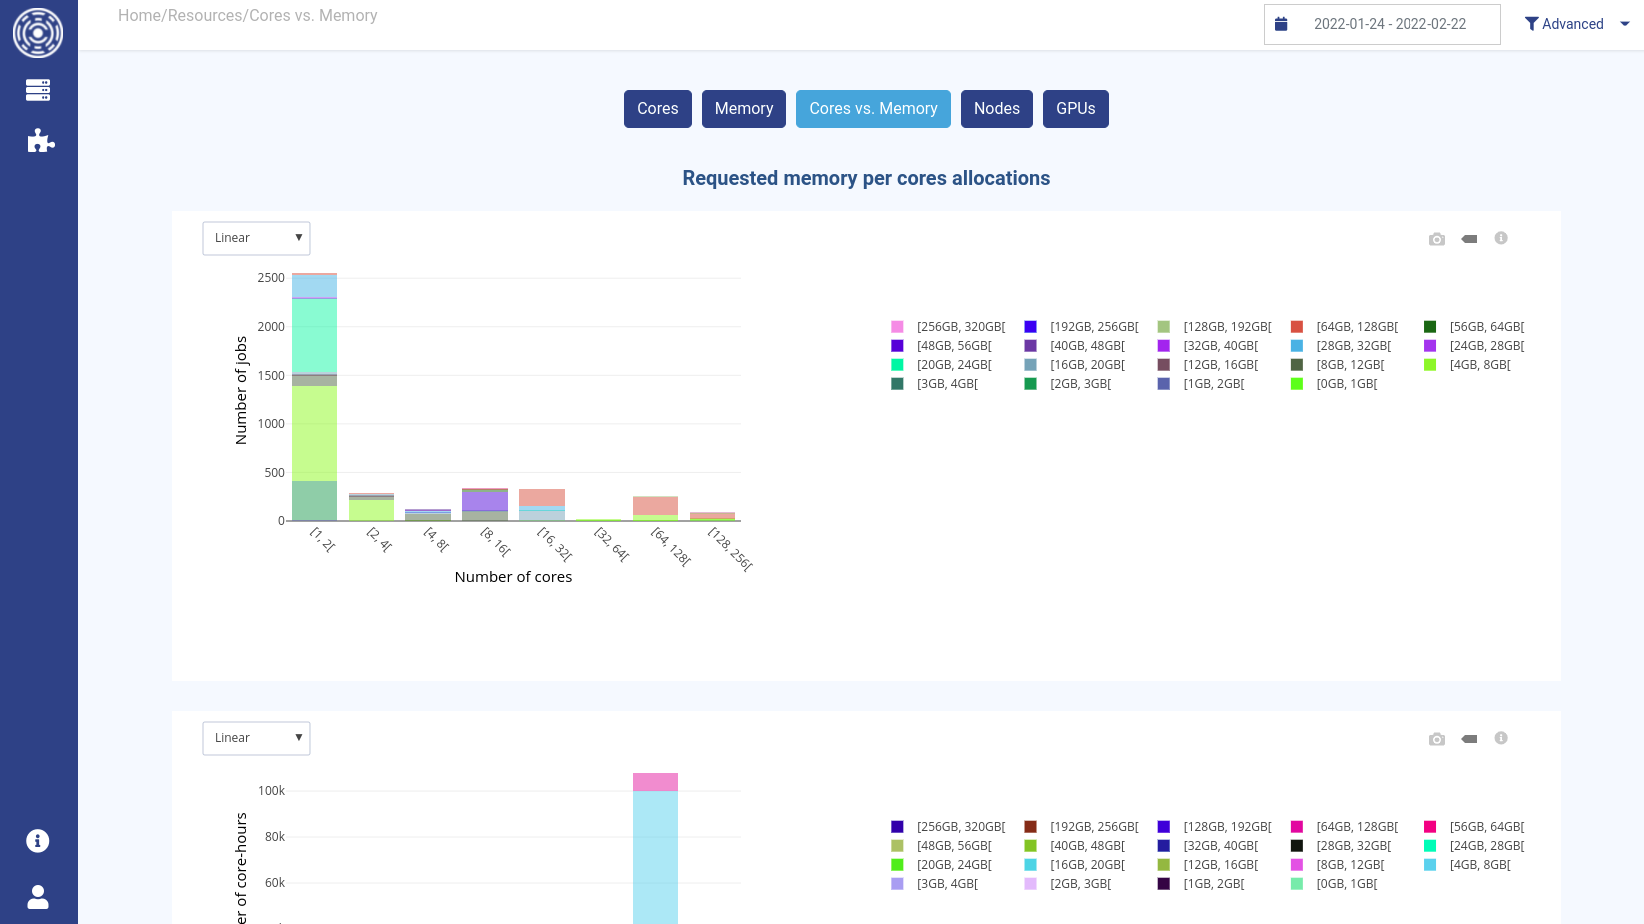
Requested and consumed memory vs. allocated cores
How it works
Use the date and advanced filters to scope the data to a specific period, partition, or user group before reading the graphs.
The requested vs. consumed memory scatter plot is particularly useful for spotting over-provisioning: a cluster of points near the bottom of the chart (low consumed / high requested ratio) indicates that jobs are requesting significantly more memory than they actually use. The caption “most jobs consumed less than 10% of the memory they required” in the example above is a typical sign of over-provisioning that can be addressed through user guidance or job policies.