Key concepts
Concept |
Description |
|---|---|
Workload |
Defines what data to query: which clusters and which filters to apply. See Workloads. |
Rule |
A Python script that receives job data and returns a list of alerts. Rules are versioned and follow a draft/publish workflow. |
Healthcheck |
The main configuration: links a workload to one or more rules, sets a schedule, and configures notifications. |
Evaluation |
A single execution of all rules in a healthcheck. Produces an overall alert level and individual alerts per rule. |
Alert level |
Severity assigned by a rule. See Alert levels. |
Notification profile |
A reusable delivery configuration (email, webhook, file). See Notification profiles. |
Alert levels
Rules return alerts with one of five severity levels:
Level |
Meaning |
|---|---|
|
No issues detected. |
|
Minor issue; informational. |
|
Moderate issue requiring attention. |
|
Serious issue requiring prompt action. |
|
Emergency condition. |
The overall alert level of an evaluation is the highest level returned by any rule. Notifications are triggered based on changes to this overall level.
Rules
A rule is a versioned Python script stored in OKA. It queries cluster data through a set of built-in data-access methods and returns a list of alerts.
Rules are managed from Healthcheck → Rules.
Rule list page
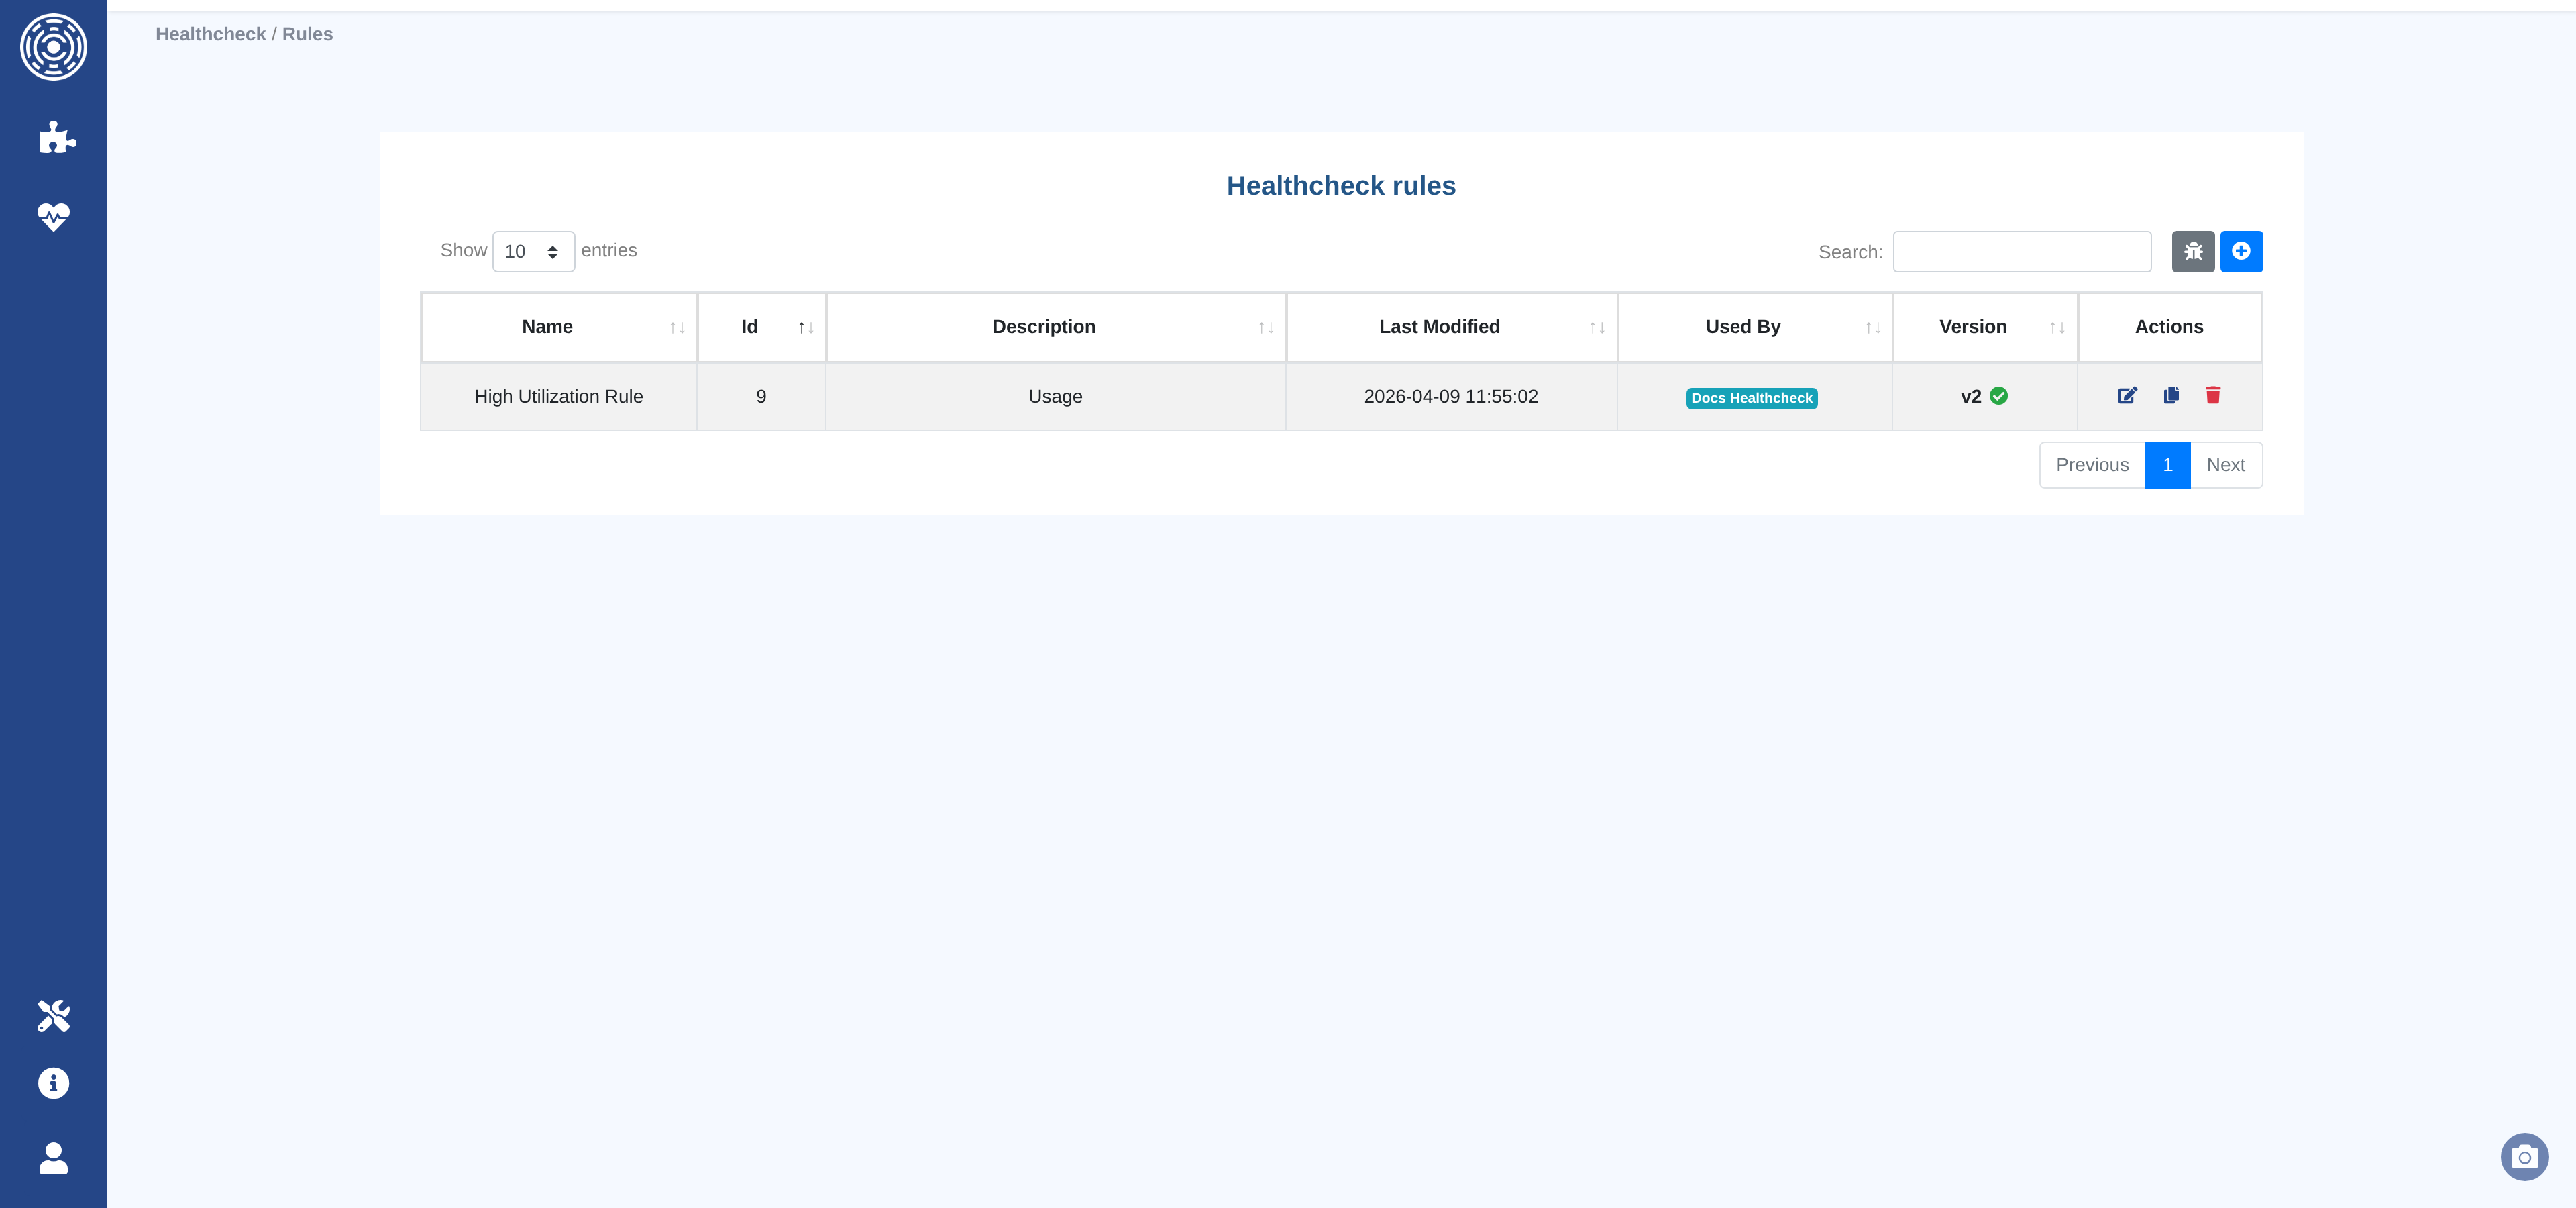
Shows all rules with their latest version, draft status, the number of healthchecks using each rule, and the last update timestamp.
From this page you can create, edit, duplicate, or delete rules, and open the test sandbox.
Creating and editing rules
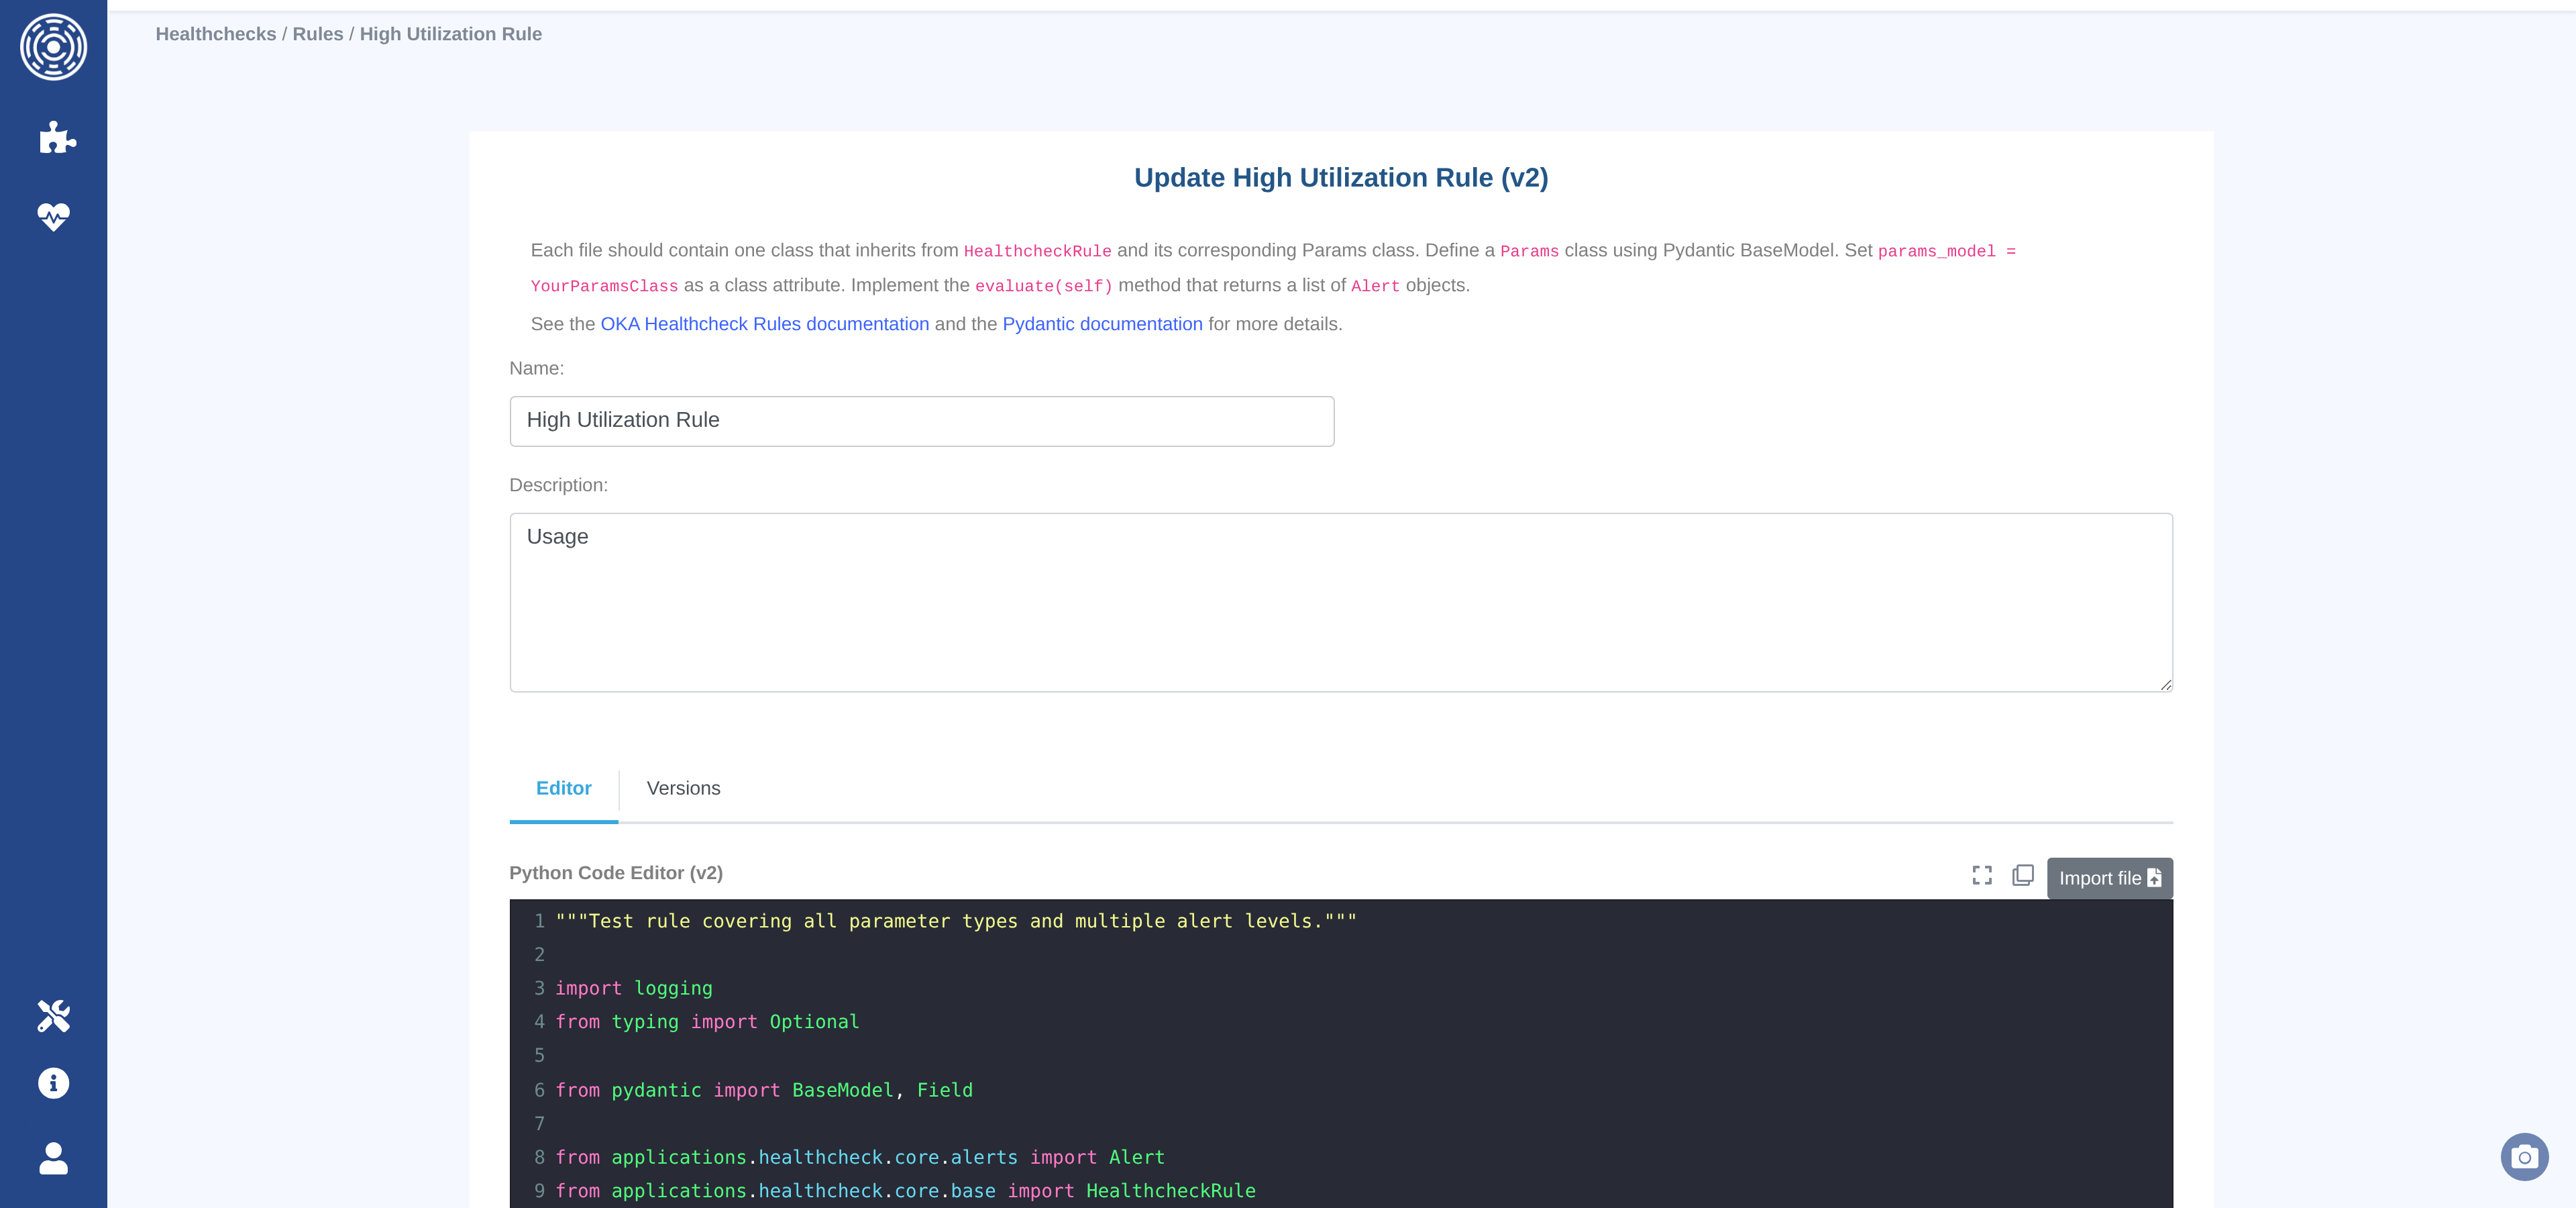
The rule editor provides a Python code editor with syntax highlighting, autocomplete, fullscreen mode, and file import. The editor follows the same draft/publish workflow as Data Enhancers:
Draft — the working version. Editable; cannot be linked to a healthcheck. Only one draft per rule at a time.
Published — an immutable snapshot. Can be assigned to healthchecks. Any further edit produces a new draft version.
To publish a draft, click Publish v{n} – Draft and enter an optional commit message. The Versions tab shows the full version history.
Rule code format
Every rule file must contain exactly one class that:
Inherits from
HealthcheckRule(from applications.healthcheck.core.base import HealthcheckRule), see HealthcheckRule to find all the available methods that allow to get access to the metrics. All methods automatically apply the workload’s cluster and filter scope.resolutiondefaults to"1hour"; supported values include"1minute","1hour","1day","1month".Defines a
params_modelclass attribute pointing to a PydanticBaseModelsubclass.Implements an
evaluate(self) -> list[Alert]method, seel Alert.
Here is an example of such a rule:
"""
Rule: High core utilization detection
Description: Alert when average core utilization exceeds thresholds.
"""

from pydantic import BaseModel, Field

from applications.healthcheck.core import Alert, HealthcheckRule
from applications.healthcheck.models import AlertLevel


class Params(BaseModel):
    high_threshold: float = Field(default=0.80, ge=0.0, le=1.0)
    critical_threshold: float = Field(default=0.95, ge=0.0, le=1.0)


class CoreLoadRule(HealthcheckRule):
    """Alert when average core utilization exceeds thresholds."""

    params_model = Params

    def evaluate(self) -> list[Alert]:
        load = self.cluster_load.get_core_load()

        if not load.timestamps:
            return []

        p = self.params
        utilization = load.utilization_rate

        if utilization >= p.critical_threshold:
            level = AlertLevel.CRITICAL
        elif utilization >= p.high_threshold:
            level = AlertLevel.HIGH
        else:
            return []

        threshold = p.critical_threshold if level == AlertLevel.CRITICAL else p.high_threshold

        return [
            Alert(
                level=level,
                title=f"Core utilization at {utilization:.1%}",
                description=(
                    f"Average {load.avg_allocated:.0f} / {load.avg_capacity:.0f} cores allocated "
                    f"over {len(load.timestamps)} buckets ({load.resolution})."
                ),
                reason=f"Utilization {utilization:.1%} exceeded threshold {threshold:.1%}.",
                metadata={
                    "utilization_rate": round(utilization, 4),
                    "avg_allocated": round(load.avg_allocated, 1),
                    "avg_capacity": round(load.avg_capacity, 1),
                    "max_allocated": round(load.max_allocated, 1),
                },
            )
        ]
Alert structure — each Alert must provide:
level— anAlertLevelenum value.title— a short summary (max 512 characters).description— a detailed explanation, or a recommendation.reason— why the alert was triggered (the specific condition that fired).metadata— adictwith any structured data useful for adding additional information and debugging.
Return an empty list ([]) when no issues are detected.
Testing rules with the sandbox
The sandbox lets you run a draft or published rule against a workload without creating an evaluation record.
Access from Healthcheck → Rules → Test sandbox, or from the rule list action menu.
Select the rule and version to test.
Select the workload to run it against.
Optionally override rule parameters.
Click Test.
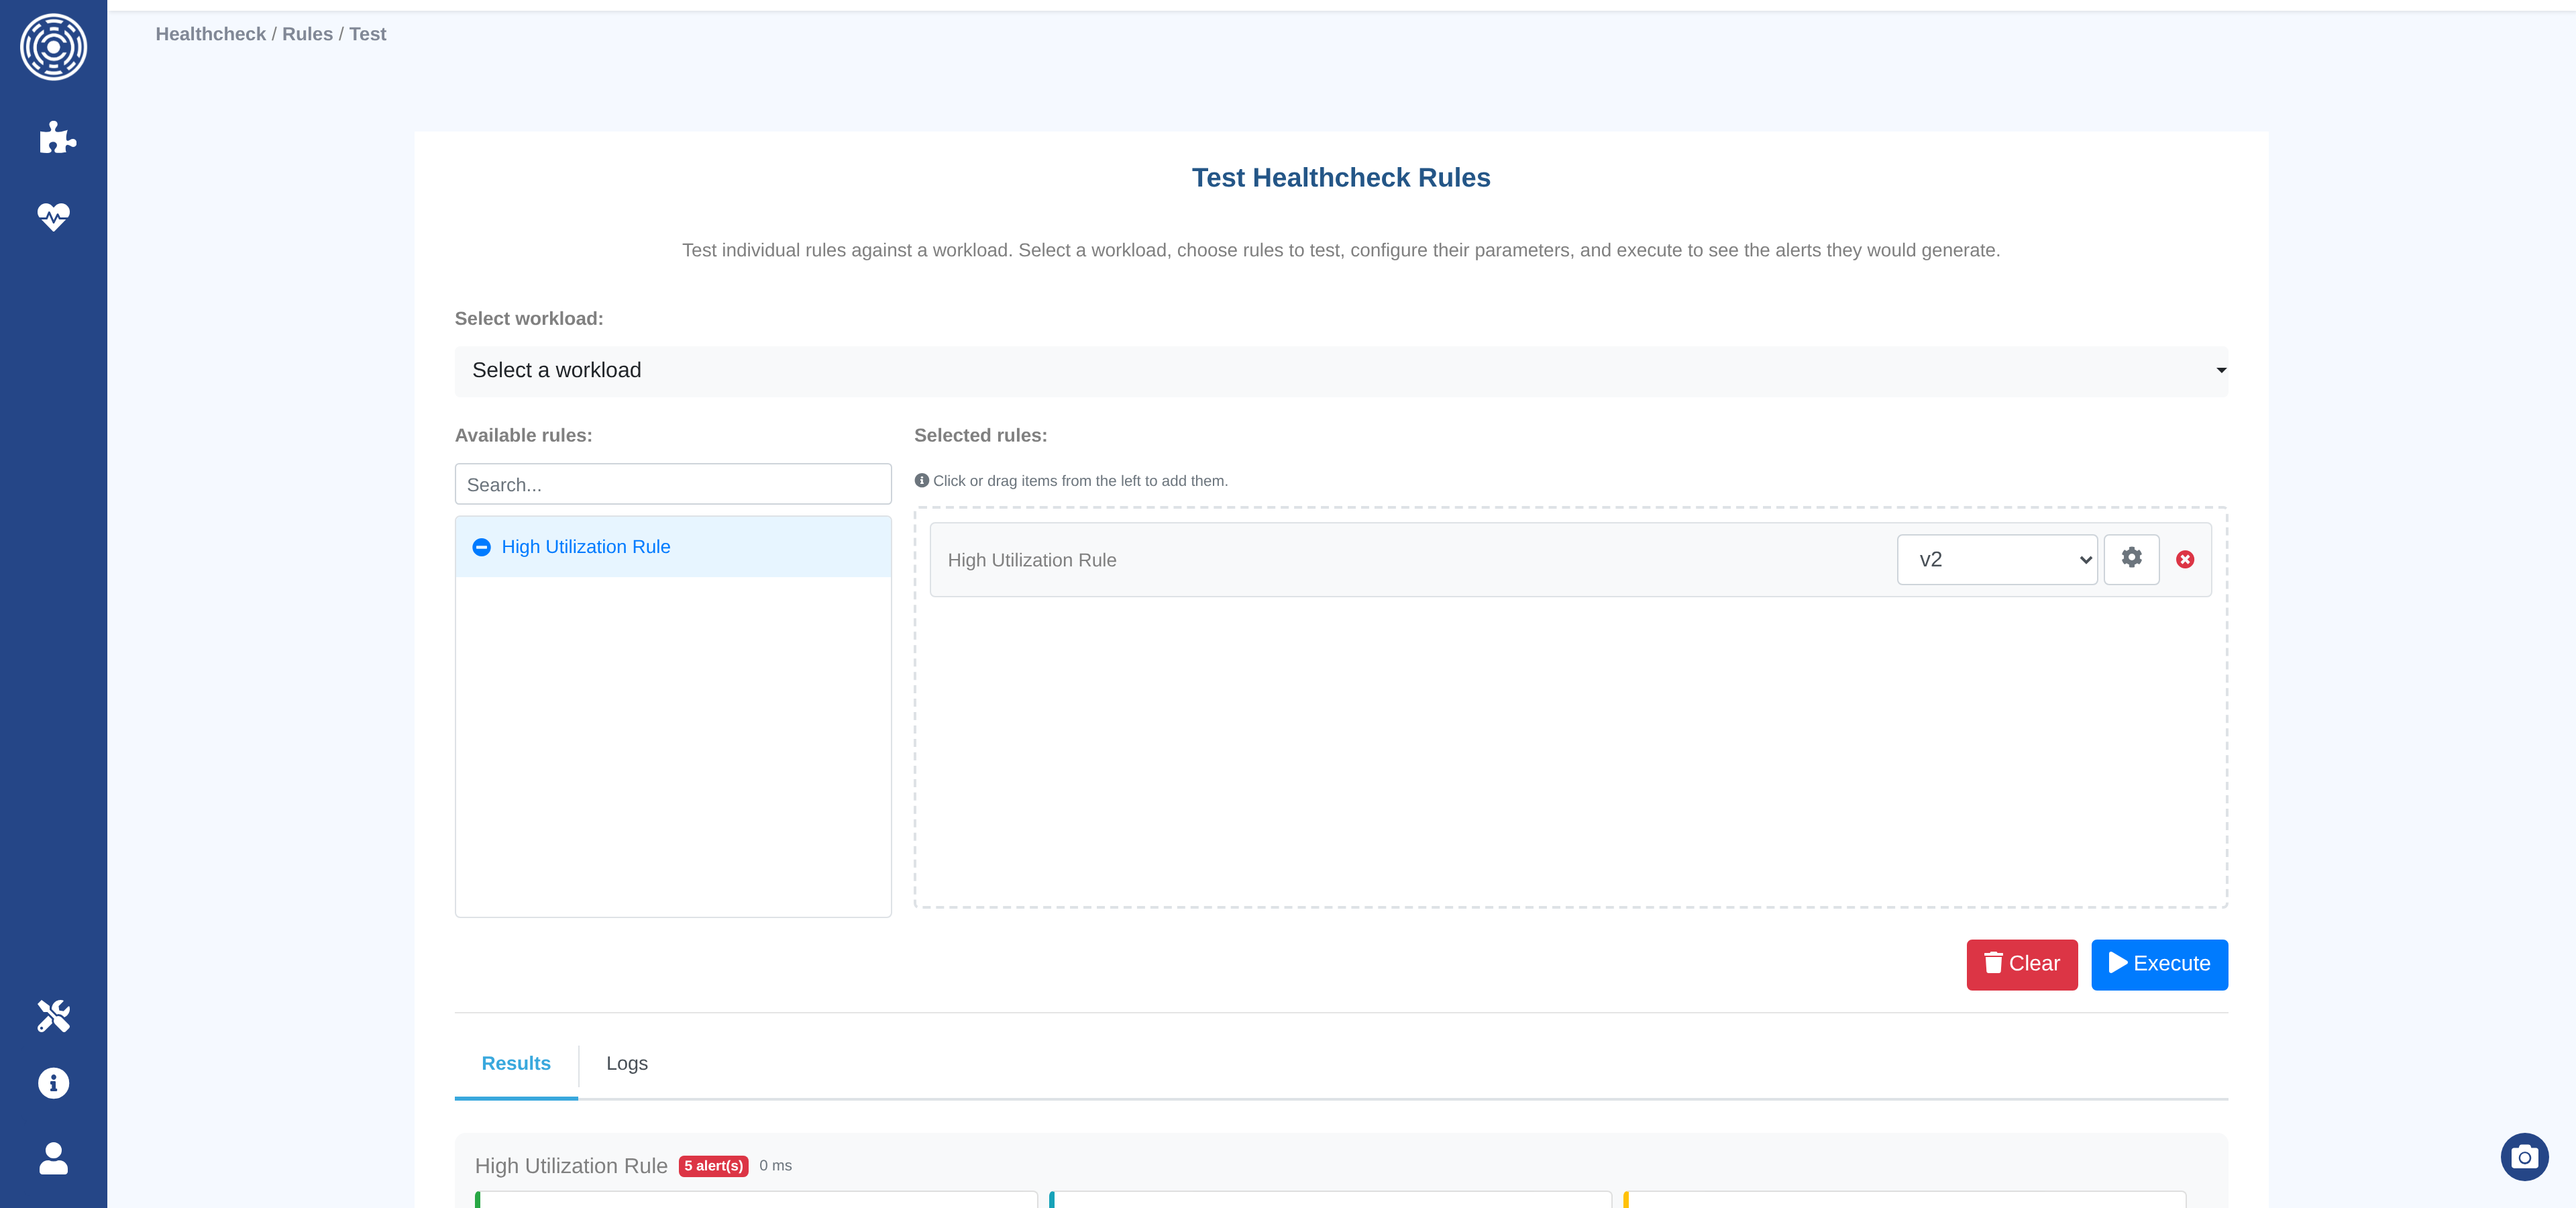
Results show the alerts returned, execution time, and any error traceback. Nothing is persisted — the sandbox is a safe development environment.
Healthchecks
A healthcheck ties together a workload, a set of rules, a schedule, and notification settings.
Healthcheck dashboard
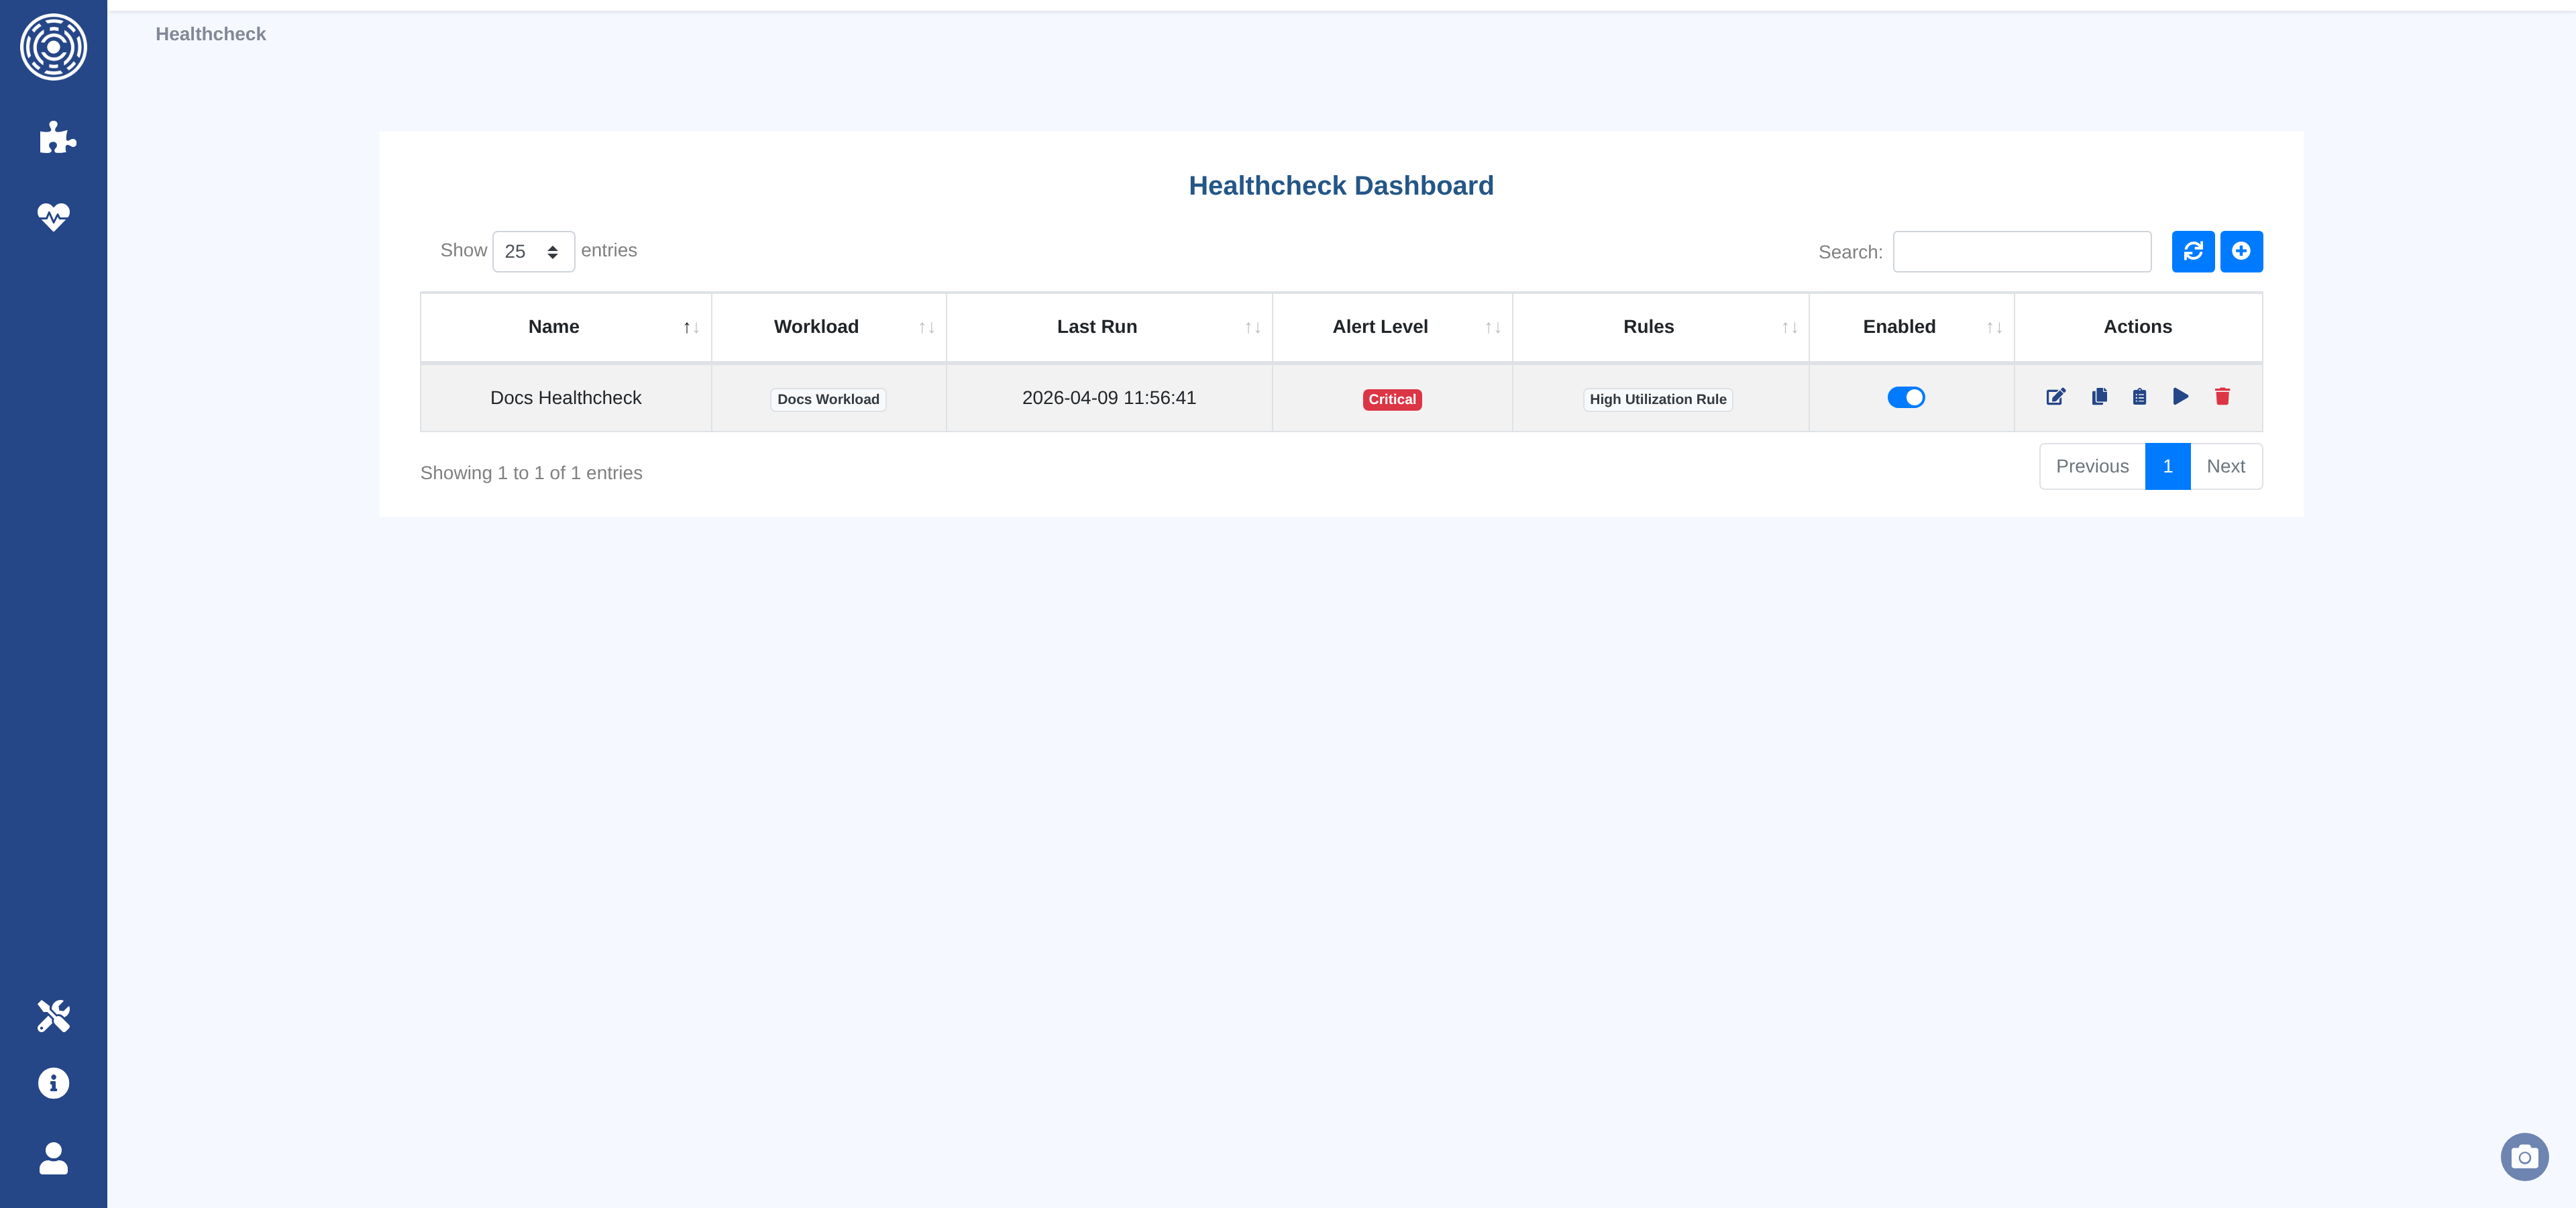
The dashboard lists all healthchecks with their workload, current overall alert level, number of linked rules, and the date of the last evaluation.
Actions available per row:
Configure — open the configuration form.
View history — open the evaluation history for this healthcheck.
Enable / Disable — pause or resume the scheduled evaluation.
Run now — trigger an immediate evaluation outside the schedule.
Creating or editing a healthcheck
The configuration form has three tabs.
General tab
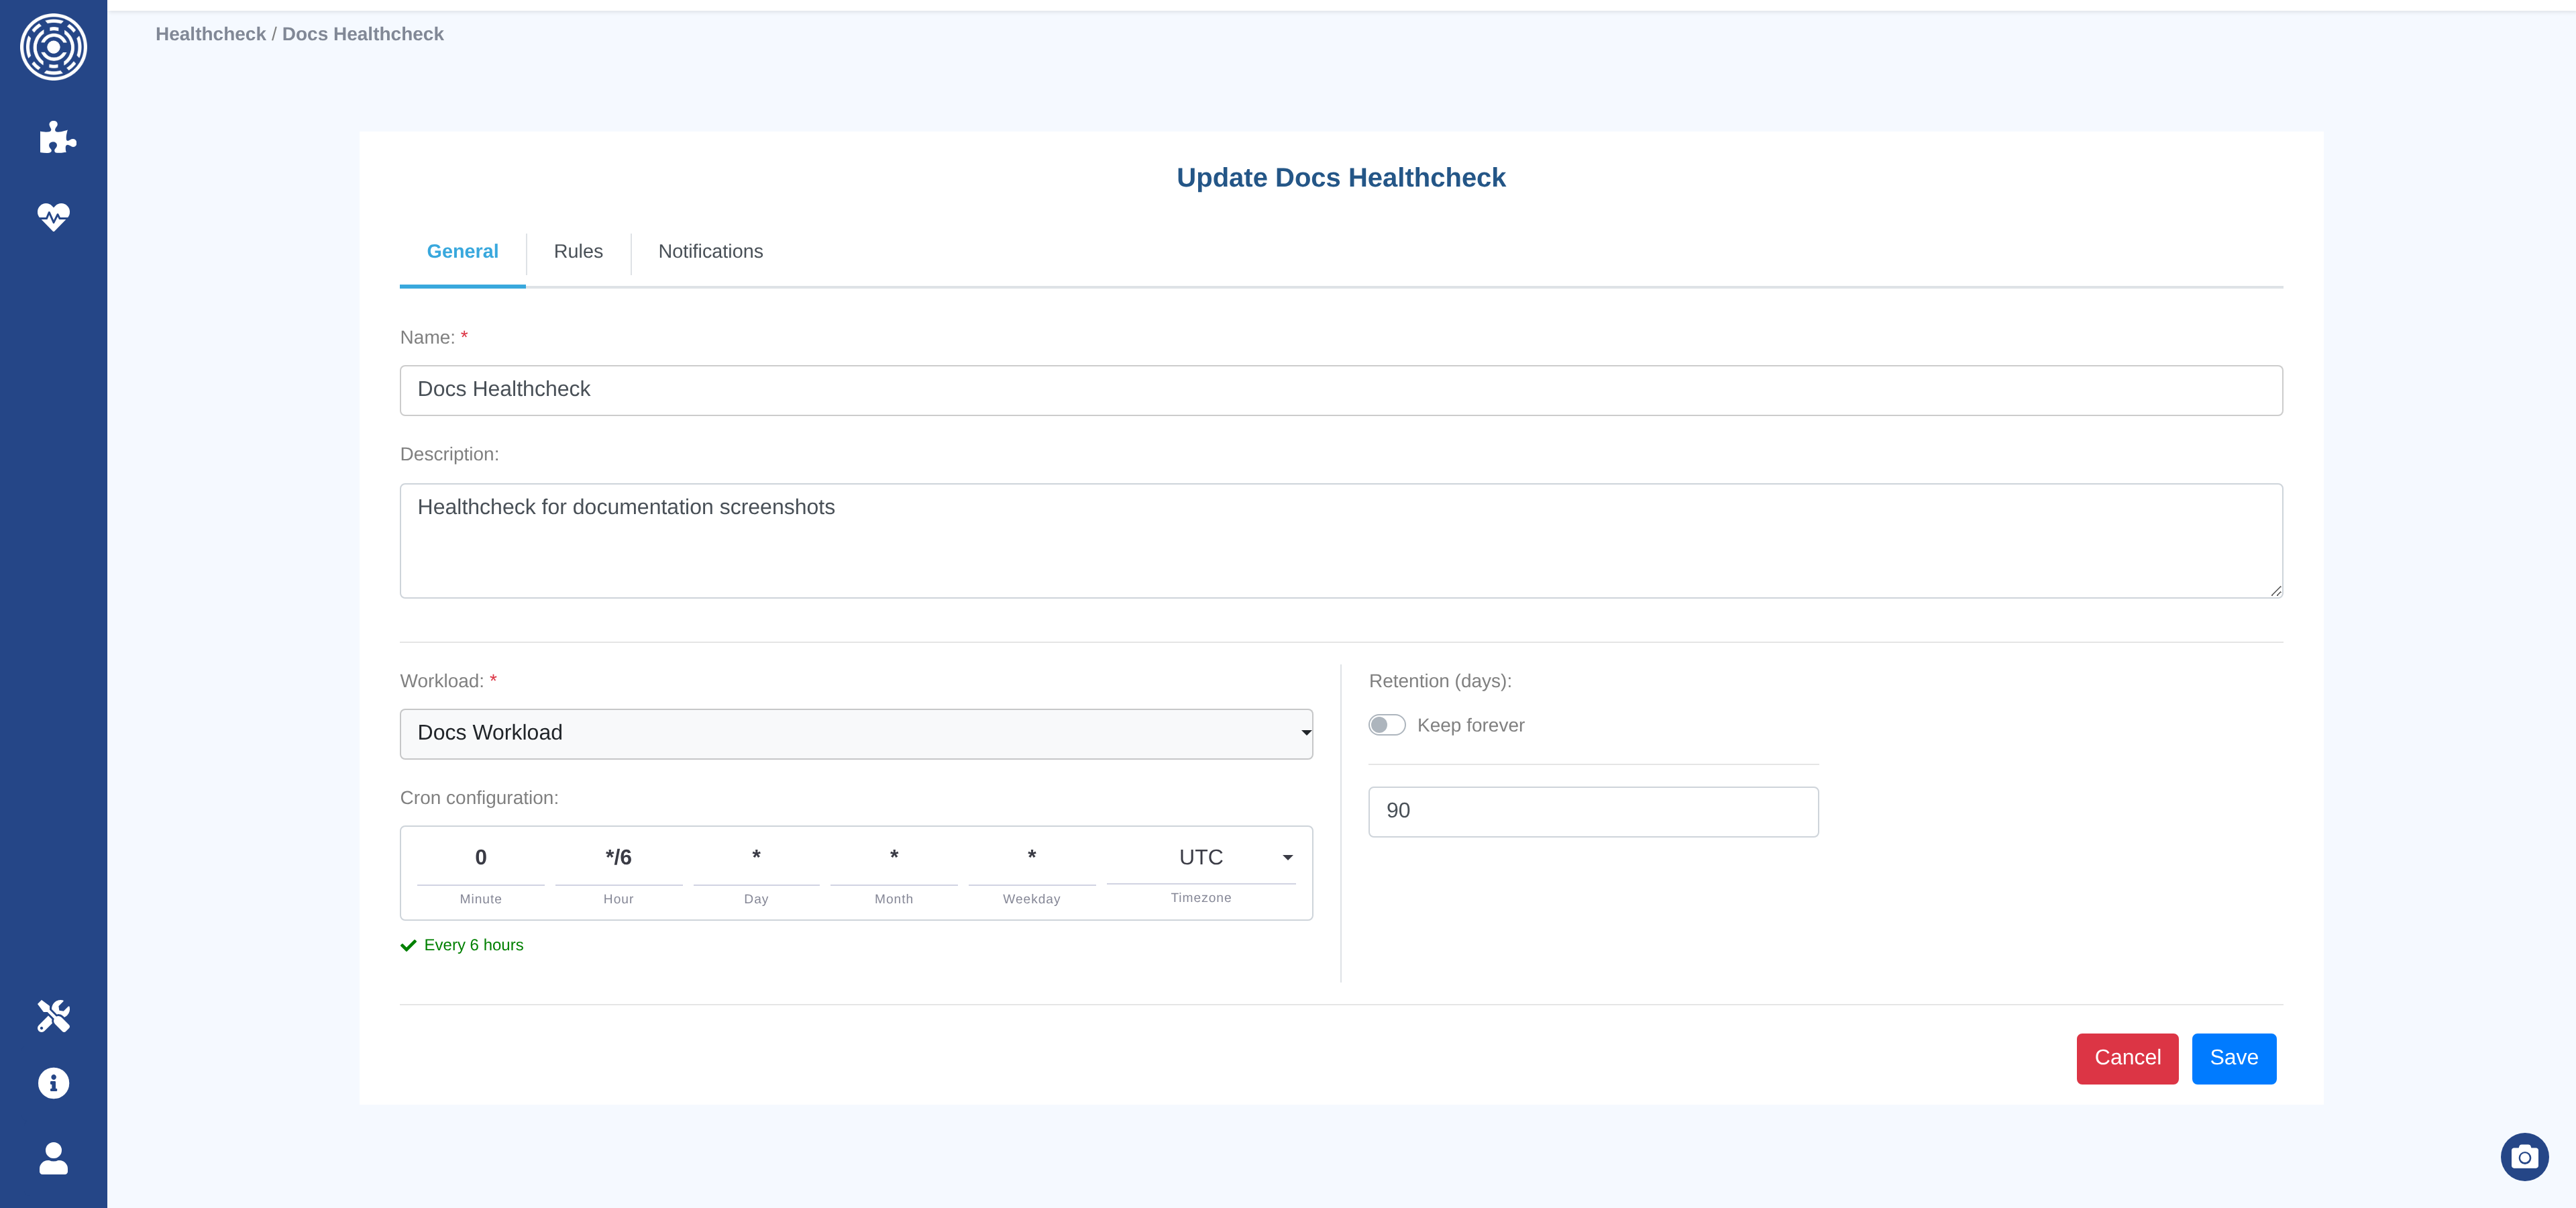
Name (required) — a unique name for this healthcheck.
Description — optional free-text description.
Workload (required) — select from existing workloads. The workload determines which clusters and filters are used for all rules.
Note
Changing the workload affects all rules in this healthcheck immediately. Workloads are shared and mutable — editing a workload impacts all healthchecks that reference it.
Schedule (cron) — when to run evaluations automatically. Uses the same cron fields as cluster ingestion (Minute, Hour, Day of Month, Day of Week, Month, Timezone).
Retention (days) — how long healthcheck evaluations are kept. Toggle on “Keep forever” if you do not want them to be automatically deleted.
Rules tab
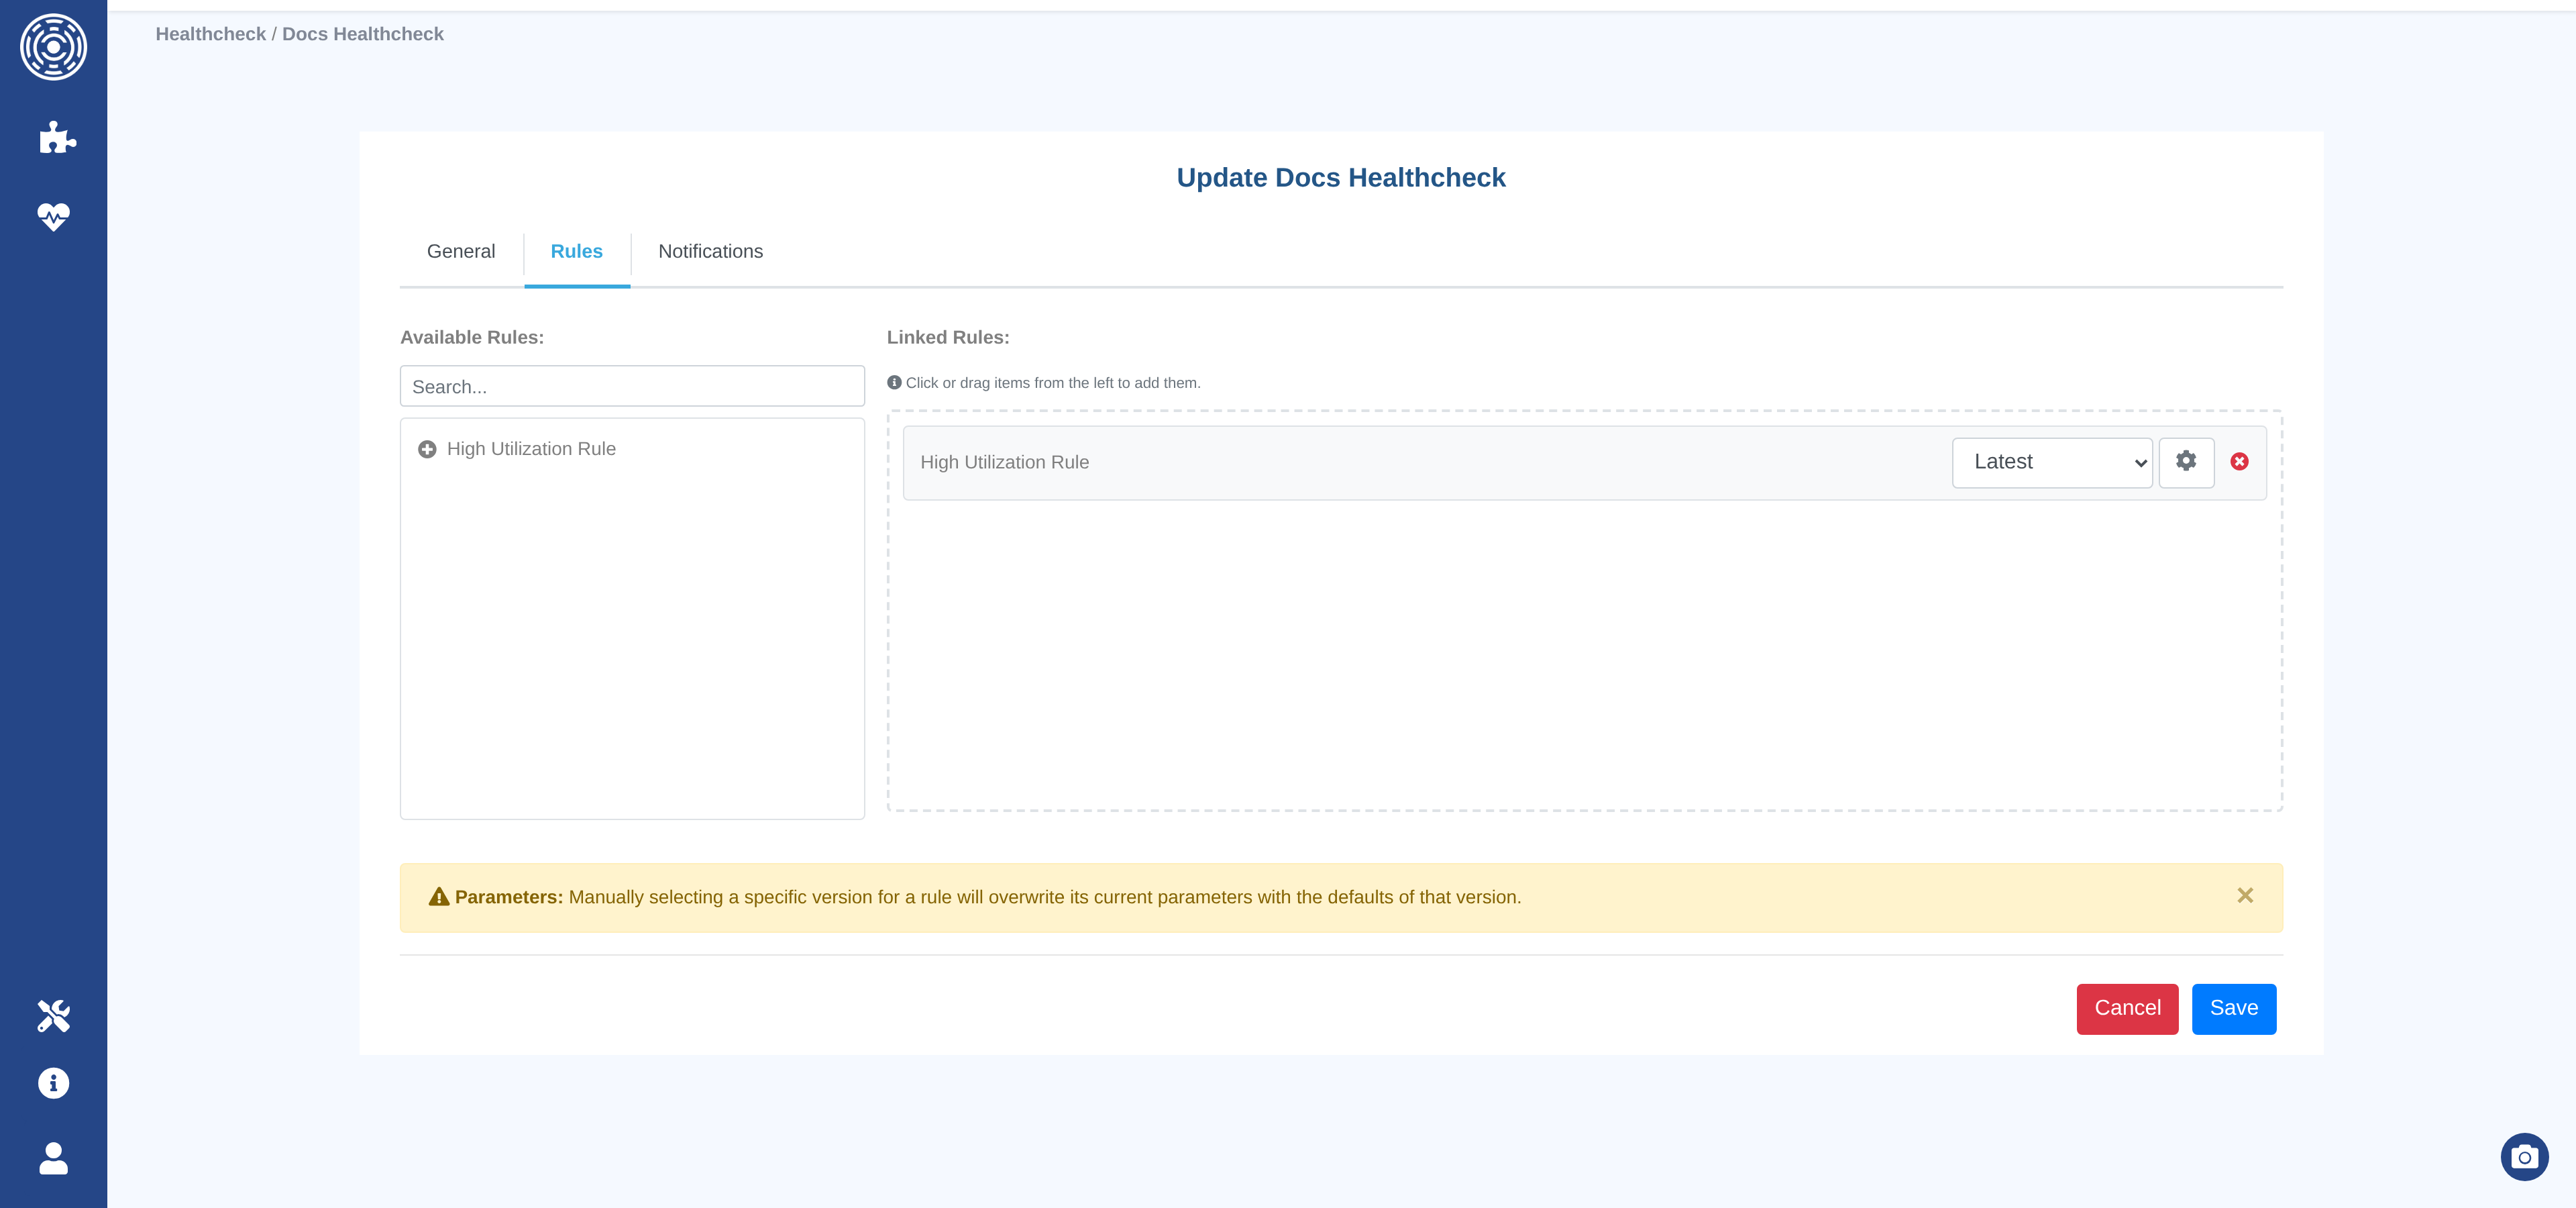
Lists the rules currently linked to this healthcheck.
Add rule — select a rule to link. Only published versions are available.
Version pinning — by default, the healthcheck always uses the latest published version of each rule (auto-upgrade). To lock to a specific version, pin it explicitly. Pinning is useful when you need reproducibility or want to control when upgrades happen.
Custom parameters — override the rule’s default parameter values for this healthcheck. Parameters not overridden inherit the rule’s published defaults.
Remove rule — unlinks the rule from this healthcheck (does not delete the rule).
Version strategy |
Behavior |
|---|---|
Latest (default, pin = null) |
Always runs the most recently published version of the rule. |
Pinned |
Always runs the specific version selected, regardless of newer publications. |
Notifications tab
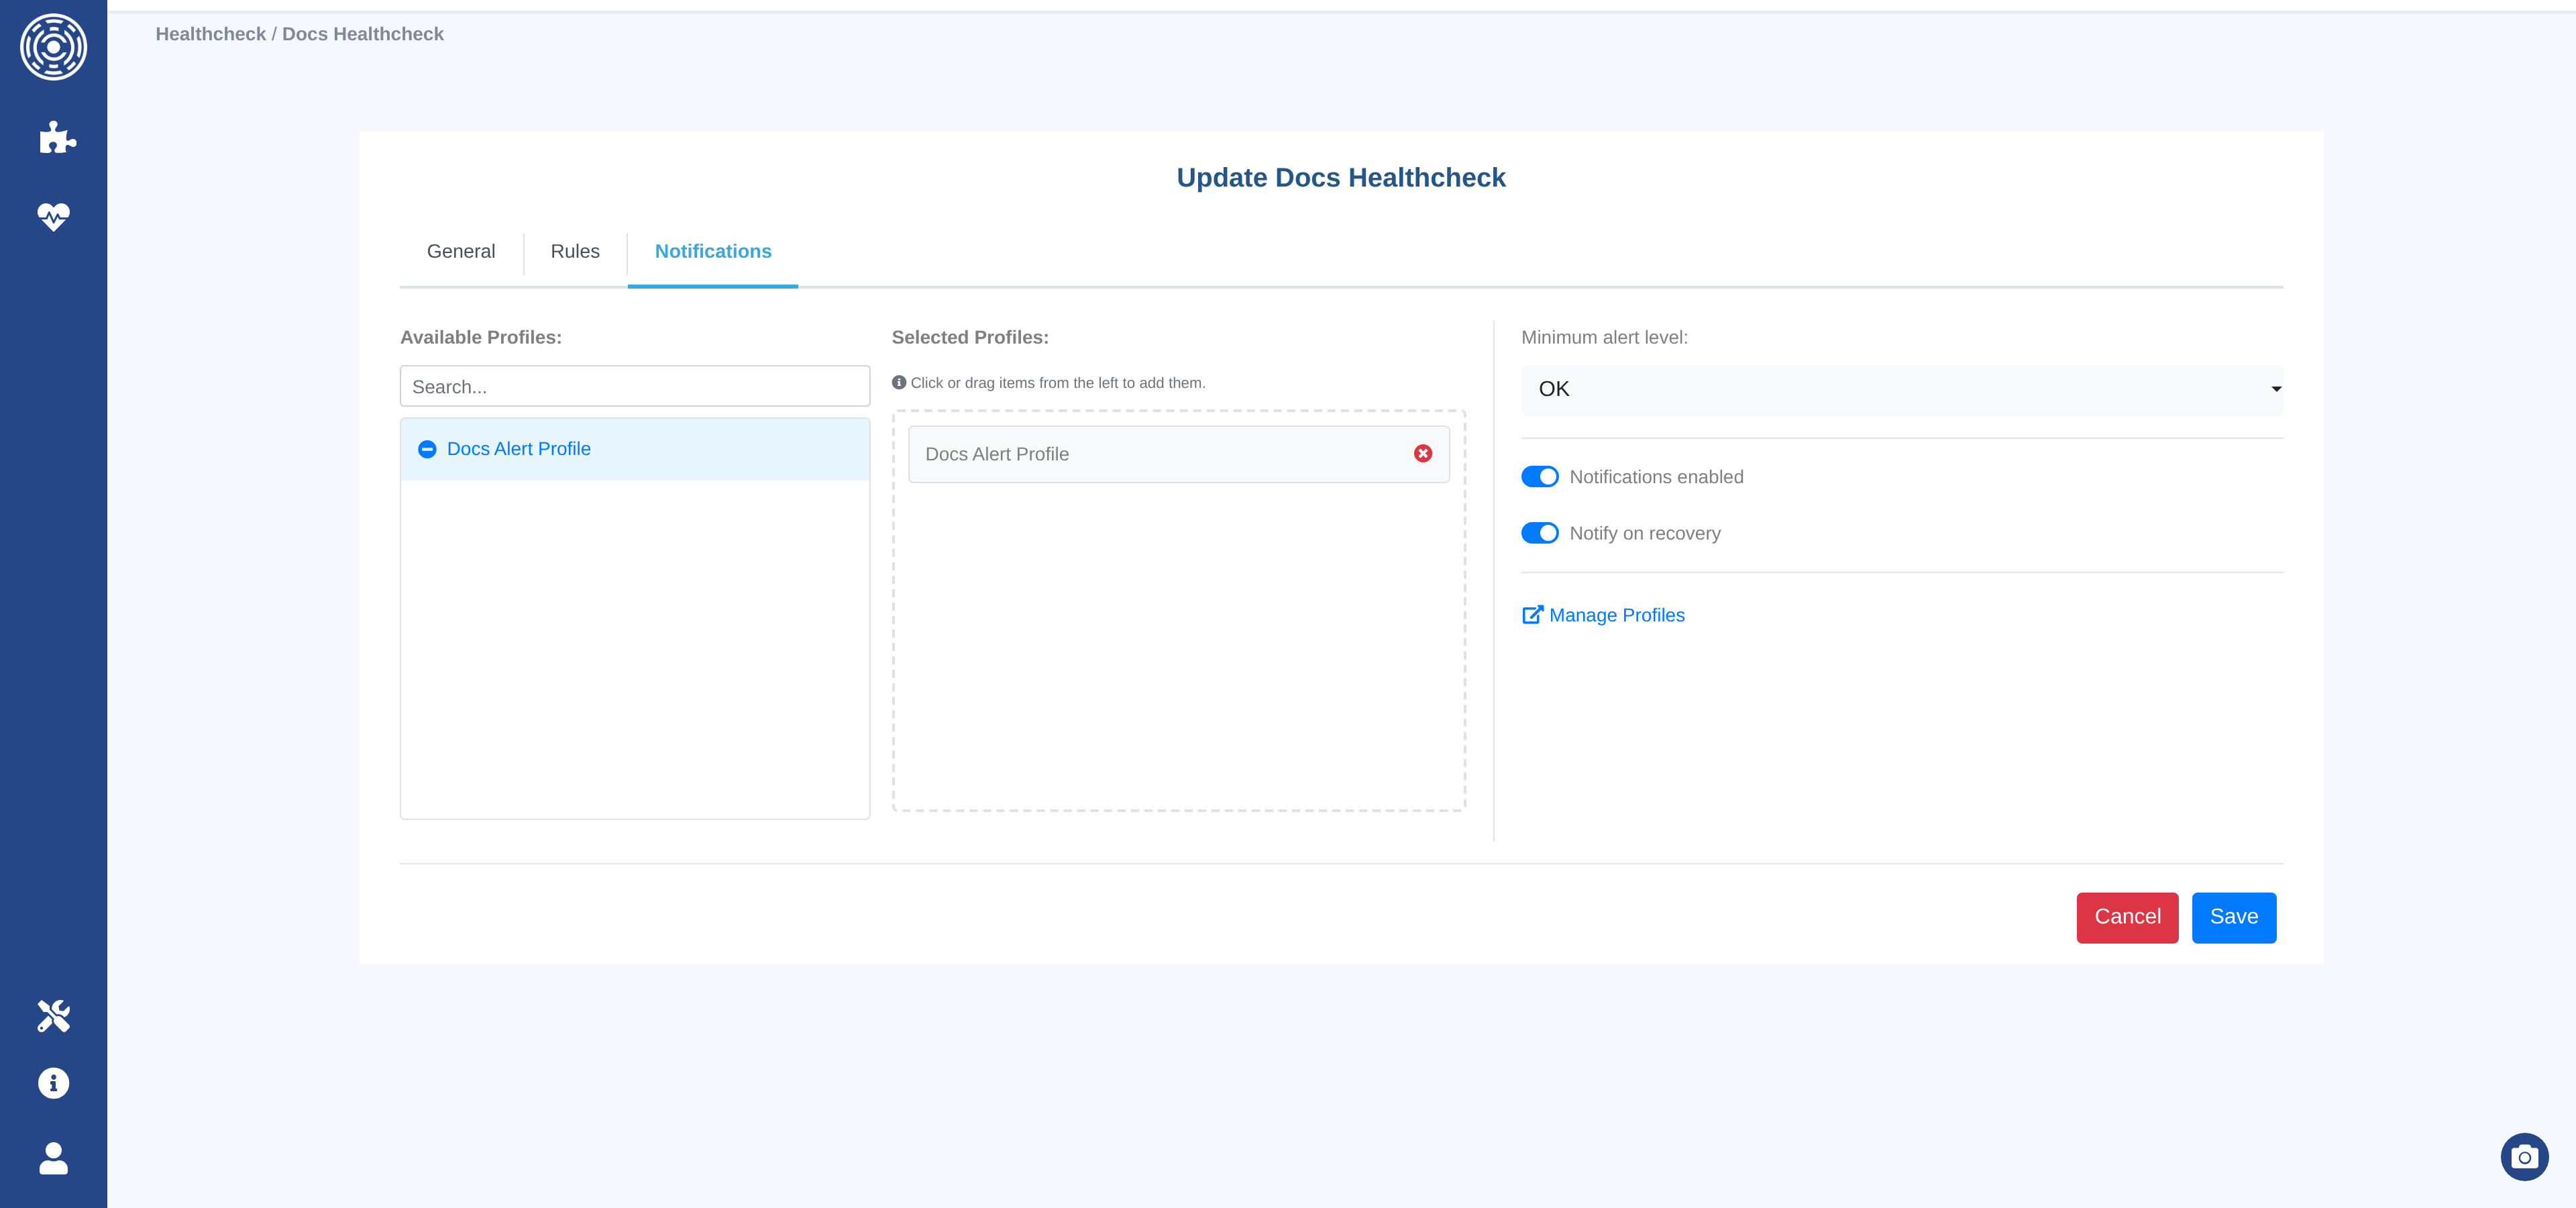
Notification Enabled — master switch. When off, no notifications are sent regardless of other settings.
Minimum alert level — only send a notification if the overall alert level is at or above this threshold (
OK,LOW,MEDIUM,HIGH,CRITICAL).Notify on recovery — send a notification when the overall alert level decreases (i.e., the situation improves). Useful for confirming that an issue is resolved.
Notification profiles — select one or more notification profiles to deliver alerts to. All channels in all selected profiles receive the notification.
Notifications are triggered when:
Notifications are enabled and
the overall alert level is at or above the minimum threshold or the level decreased and “notify on recovery” is enabled.
Evaluation history
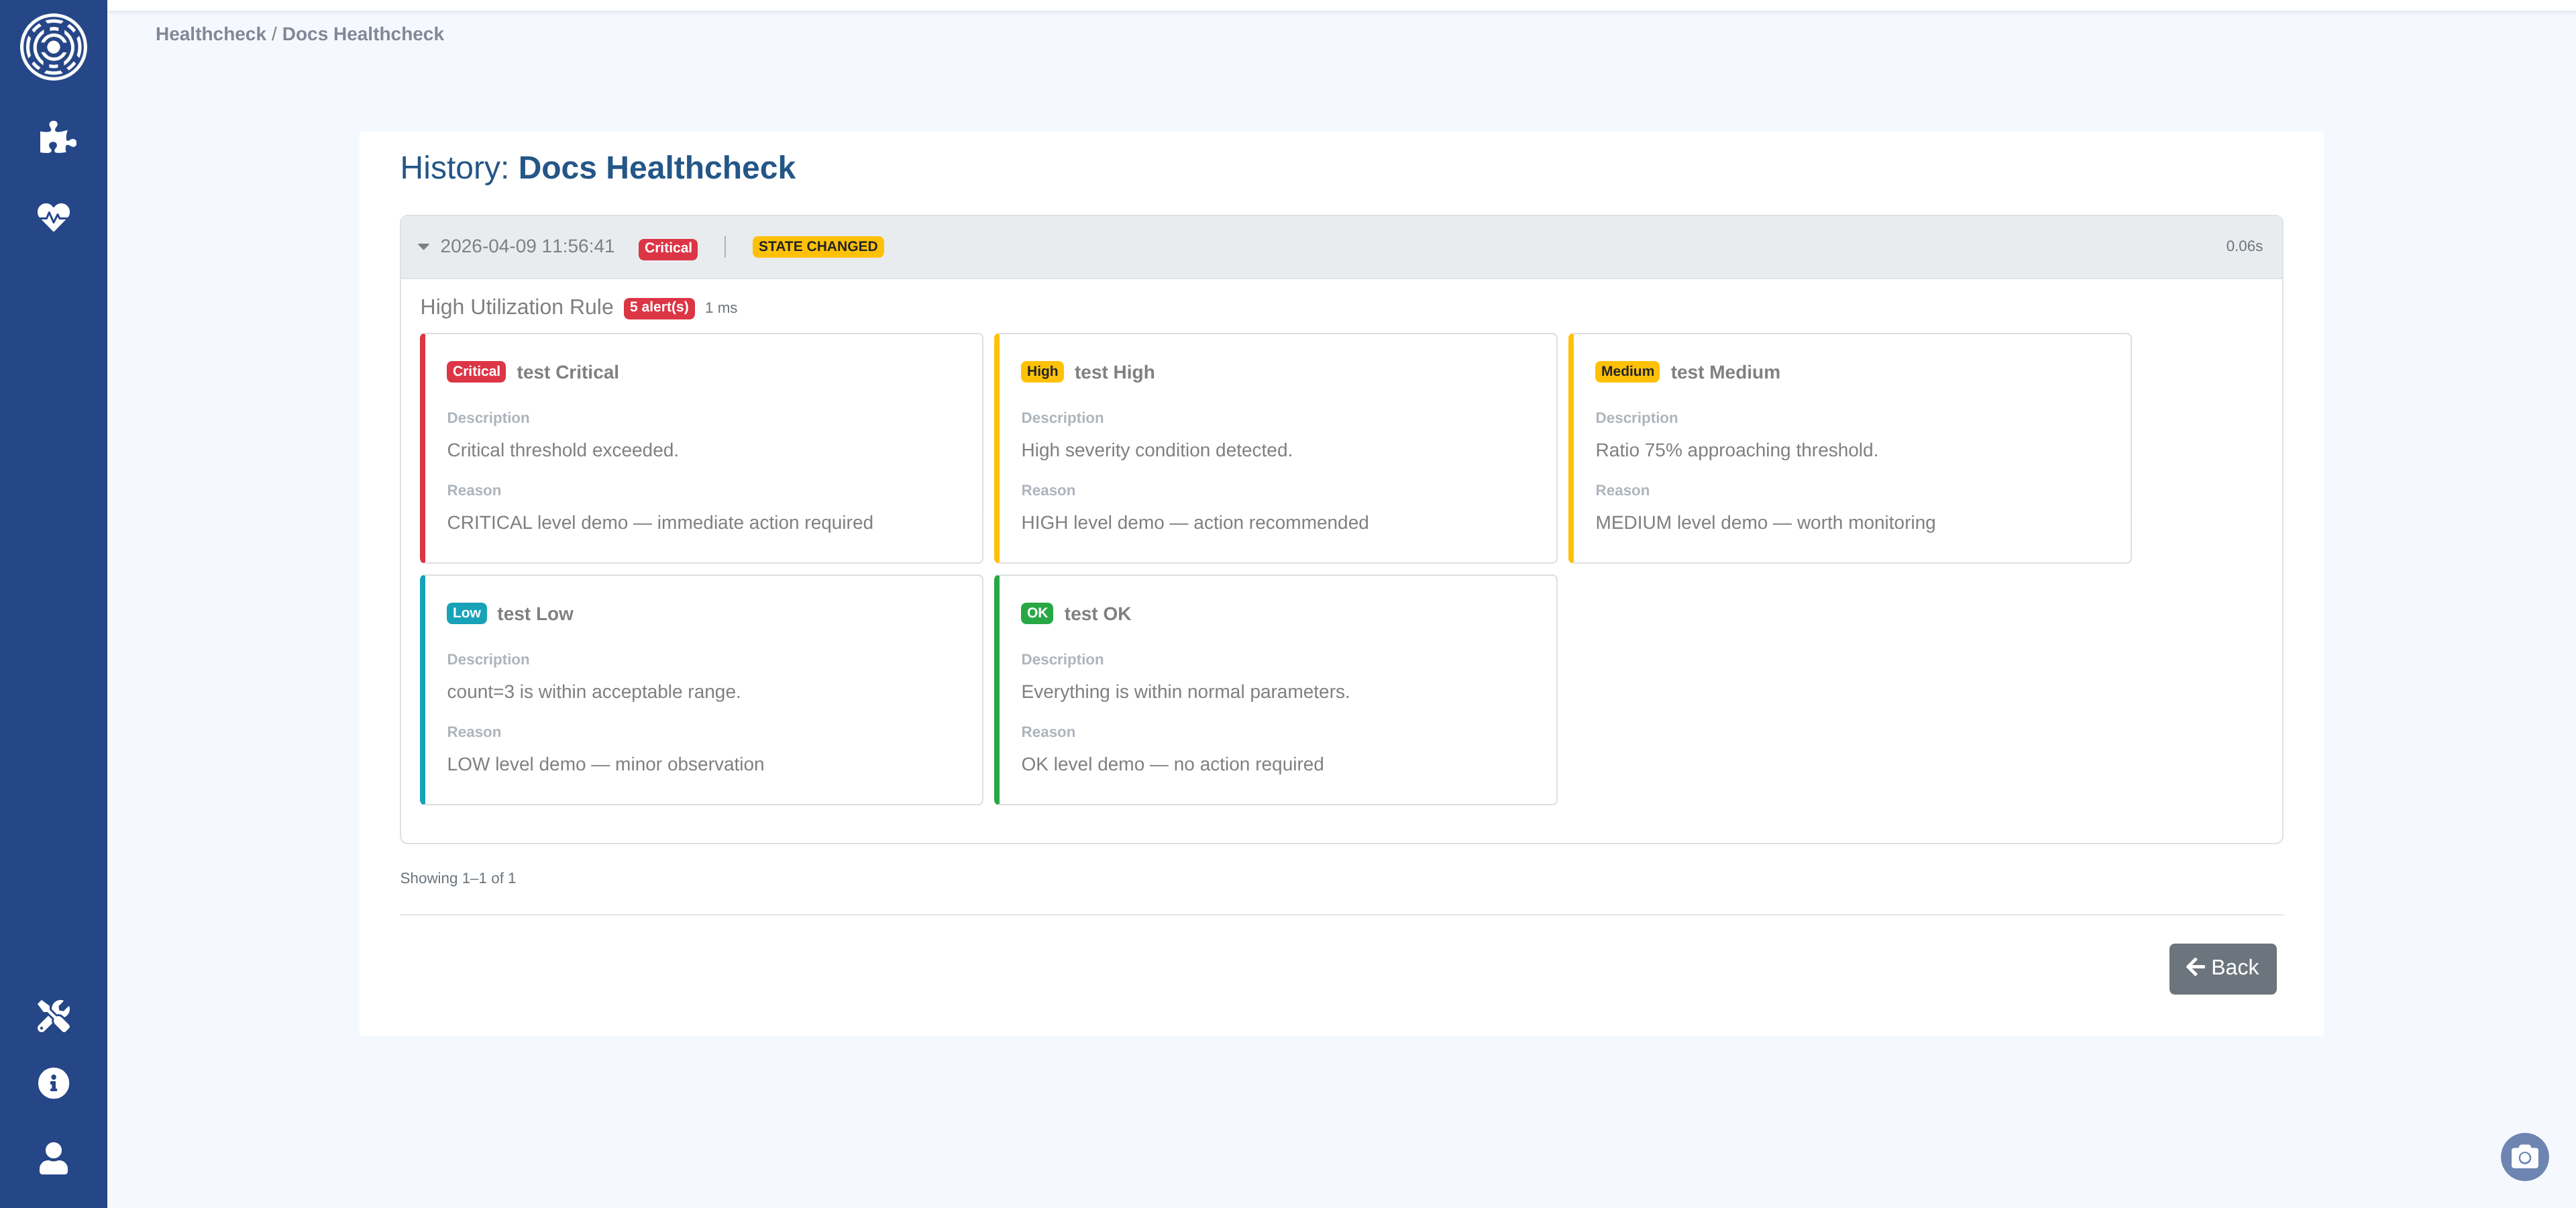
The evaluation history page for a healthcheck shows:
Each evaluation’s timestamp, overall alert level, and execution time.
Whether the alert level changed compared to the previous evaluation.
Per-rule breakdowns: which version ran, the effective parameters, execution time, and any error.
Individual alerts: level, title, description, reason, and metadata.
Note
History is kept according to the healthcheck’s retention setting. Activate “Keep forever” to keep evaluations indefinitely. Otherwise, evaluations older than the configured number of days are deleted automatically.